
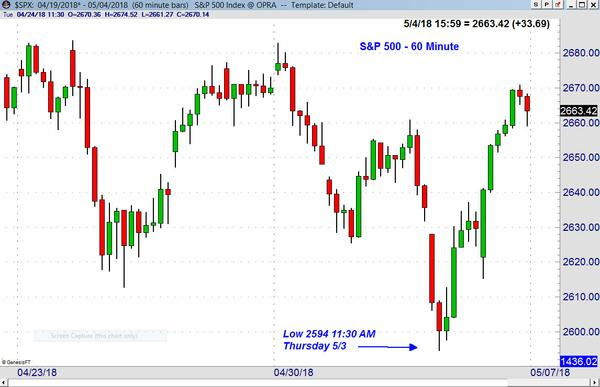
Should You Be Getting Ready to Buy? May 4, 2018
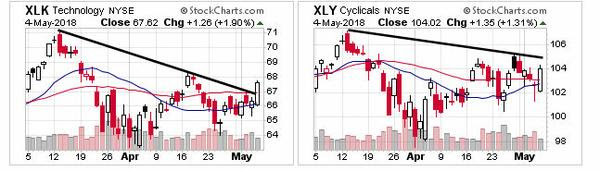
The reversal from Thursday’s early decline and the strong action on Friday was impressive . It was an encouraging sign for those who think the correction from the January high is just a pause in the market’s uptrend. The market internals were strong with 2239 stocks advancing and just 746 declining. In today’s Forbes.com article I discuss the Five Most Oversold Dow Stocks as many major stocks have now reached important support. The Nasdaq 100 was up 1.90% for the day while the small cap Russell 2000 and S&P 500 were up close to 1.3%. This may be an early sign that the worst of the selling is over but further improvement is needed to confirm that the market’s correction is over. Two of the ETFs that Viper ETF clients have been buying (see below) did well on Friday with XLK up 1.9% and XLY up 1.3%. Once all the A/D lines turn positive it will be a time to be a more aggressive buyer. If you are interested in buying once the correction is over I hope you will consider a subscription to the Viper ETF Report or the Viper Hot Stocks Report.
Wall Street Experts Confused While Individuals Are Worried - April 12, 2018The stock market volatility has continued this week, as the sharp rally early Monday was hit with heavy selling in the afternoon, as news hit regarding a FBI raid on President Trump’s lawyer. Stocks managed to recover in Tuesday’s session, but then closed lower on Wednesday.
The stock market’s erratic behavior over the past two months has made many individual investors quite nervous. In the January 25th survey by the American Association of Individual Investors (AAII), 54.1% of individual investors were bullish.
In the latest survey, released earlier today, only 26.1% are now bullish, while 42.8% are bearish. It is not surprising that the average investor is confused, as you can find experts from large money management companies giving wildly different opinions on financial networks.
Earlier today on CNBC, BlackRock’s Chairman and CEO Larry Fink said "The key for investors is to stay in the market. [...] You should be 100 percent in equities." On the other hand, Byron Wien, Vice Chairman at Blackstone and a 50-year Wall Street veteran warned that there was too much complacency. He is looking for a test of the lows, saying “that’s going to be a terrific buying opportunity."
Creating this type of confusion leads many traders and investors to miss some great opportunities. That is why I have always worked hard to educate my subscribers.
In last Thursday’s Viper ETF and Viper Hot Stocks Reports, I commented that “the technical action is suggesting that Wednesday’s reversal may mark a short-term low. The market will need further improvement in the market internals to confirm that it is an important bottom, and volatility is likely to remain high.”
ETF traders and investors did some light buying last week in the financial ETFs, like SPDR S&P Regional Banking ETF (KRE), which was up over 2% on Thursday. Even though the lows in the major averages have not been confirmed many stocks have completed nice technical bottom formations.
Viper Hot Stock traders bought Apple (AAPL) on Monday’s open, and it is already up almost $5 from the entry price. Our long positions in CHRW, CIEN, IDCC, HA, CYBR and SIMO are also showing nice profits.
If you are interested in detailed market analysis and want to become a better investor or trader I hope you will sign up for either the Viper ETF Report or Viper Hot Stocks Report. New subscribers to either service will also receive the following five trading lessons:
|


Using Volatility To Your Advantage - April 5, 2018
 |
The relative performance, which measures the performance of HA versus the S&P 500, had broken its downtrend (line a). This was a bullish sign, as it indicated that HA was going to perform better than the market. The OBV was also positive, as it had moved strongly above the resistance (line b).
HA had closed on March 29th at $38.70. I wanted to buy 50% at $37.59 and 50% at $36.77. HA traded as low as $36.70 on Monday, April 2nd, so both buy levels were hit. Half the position was sold today at $41.12 for over a 10% profit. Of course, not all of my recommendations turn out this perfectly, but my methods of analysis often lead to this type of recommendation.
If you are interested in more detailed market analysis, consider signing up for either the Viper ETF Report or Viper Hot Stocks Report for specific recommendations on ETFs or stocks. New subscribers to either service will also receive the following five trading lessons:
What Should Stock Investors Expect In April? - April 1, 2018

As I pointed out in my weekend article The Week Ahead: Rough Waters or Smooth Sailing Ahead For Investors? April is historically one of the best months for the stock market over the past 10 as indicated in the table below.

But despite Thursday’s rally and good gains for the week the daily A/D line analysis has not yet signaled that the market’s correction is over. It is being monitored daily.
This is discussed in detail in the article and there will be a few new buy recommendations for Viper ETF traders in Monday’s report.
The attached S&P 500 weekly buy and sell list was sent out Sunday morning as a bonus for Viper Hot Stocks subscribers and I am reviewing the weekly buys and sells for Monday’s report.
If you are interested in learning more about the markets and in getting actionable advice on ETFs or stocks please subscribe to either the
Viper ETF Report or Viper Hot Stocks Report.
Each report is only $34.95 per month and can be canceled online at any time.
As a new subscriber bonus for either premium service, you will also receive the following five trading lessons.
- Managing Risk & Profiting With Starc Bands
- The Most Profitable Candle Formations
- Quarterly Pivot Levels For Trend Analysis
- A Simple But Valuable Tool
- Volume Precedes Price
Don't Buy Until The Correction Is Over - March 28, 2018

The analysis in my weekend article The Week Ahead: Should Investors Start Preparing For A Bear Market? indicated that the stock market was in the corrective mode.
In listening to CNBC on Monday it was clear that some thought the market had already bottomed as the Dow closed up 669 points. I was wishing investors knew not to buy as I was confident the rally would fail.

My experience in watching the market internals for many years made we quite confident that we would see a sharp rally but that it would ultimately fail.
In Monday morning's Viper ETF Report I commented that the Spyder Trust (SPY) was likely to have “a 1-2 day bounce that could reach the $265-$268 area”.
After Monday’s sharp gains the SPY had a high early Tuesday of $266.77 which was right in the middle of my target zone. It closed Tuesday at $260.60.
For traders the strategy was to buy the inverse ETFs, specifically the ProShares UltraShort Dow30 (DXD) or the S&P 500 Bear 3X (SPXS), when they corrected as the market moved higher.

The 10 minute chart of the Direxion Daily S&P 500 Bear 3X (SPXS) shows that the first buy level was hit late Monday but the second buy level was just missed early Tuesday. Both buy levels were hit in ProShares UltraShort Dow30 (DXD).
The stock market looks ready to close the week lower ahead of the long weekend.
For investors, monitoring the key advance/decline lines will be important in identifying the next good buying opportunity. It will benefit both investors and traders to be patient in the coming weeks as you do not want to buy too early.
If you are interested in learning more about the stock market and investing I hope you will consider a subscription to either the Viper ETF Report or Viper Hot Stocks Report,
Subscribers get two reports each week and special reports when they are needed like on Tuesday’s morning. The reports include a detailed market commentary including my A/D line analysis and specific recommendations.
Buckle Your Seat Belts - March 25, 2018

The weak rally from last Monday’s lows reinforced my concern over the market that I expressed last in last Sunday’s email. The S&P 500 broke the intra-day support (line a) after the FOMC announcement.
I warned early in the year that it was not going to be a buy and hold year. I am expecting the volatility to be high for good part of the 2nd quarter.
Investors and traders will have to be in touch with the daily A/D line analysis in order to identify the next good buying opportunity like we did on February 12th and in Feb. 2016.
In my weekend article The Week Ahead: Should Investors Start Preparing For A Bear Market? I look at the monthly, weekly and daily A/D analysis after last week's action.
We have closed out many positions this week that were established at lower levels and banked some nice profits.
I am very confident that I can help you navigate these difficult markets so I hope you will consider a subscription to either the Viper ETF Report or Viper Hot Stocks Report
Reports are generally sent out every Monday and Thursday. They include a detailed market commentary including my A/D line analysis as well as specific recommendations.
Yes, Prices Did Break This Week!! - March 22, 2018

In Sunday’s update I wondered Will Prices Break This Week ? The evidence indicated then that the stock market was approaching a critical juncture and the action early in the week would be important.
The selling on Monday and the weak rally Tuesday clearly weakened the market’s uptrend. The rally failure after the FOMC decision to hike rates confirmed a negative short term outlook.

This is evident in the chart of the NYSE Composite with the NYSE A/D line that was included in this morning’s reports.
As I noted in early January (The Week Ahead: Investing Or Trading In 2018?) I thought that it was not going to be a buy & hold year as traders were likely to do better. The action so far this year has supported this view.
Just a brief update tonight as I will have a full market update over the weekend. It was a very ugly day with the S&P 500 down 68 points and the Dow dropping 723. The A/D numbers were almost 5-1 negative.
We have closed out many positions this week that were established at lower levels and tightened a number of stops. The drop today suggests there will is going to be more choppy action ahead.
I am confident that I can help you navigate these difficult markets so I hope you will consider a subscription to either the Viper ETF Report or Viper Hot Stocks Report .
The reports are sent out every Monday and Thursday. They include a detailed market commentary as well as specific recommendations.
Will Prices Break This Week? - March 18, 2018

As the chart indicates it was not a good week for the markets as only the Dow Utilities bucked the trend up 2.9% for the week.
In my weekend article I discuss why flexibility is an important trait for successful investors and traders. I would bet that most of you have bought a stock or ETF that soon starts dropping.
Instead of selling or using a stop you hang on as it drops 5% then 10% from your entry price. Many do not sell as they will not believe or admit that their original reason for buying was wrong.
One or two losses of 10-15% can seriously damage your portfolio performance even if you have a number of winning positions. My methods of using the RS and OBV will help you tell when to get out.
Though my intermediate-term analysis on the stock market is positive the Spyder Trust (SPY) really needs to close above $280 to signal a move to new all-time highs.

The chart shows that SPY could also break to the downside but at this point it is a less likely scenario. For a full analysis see my weekend article.
Of course, the PowerShares QQQ Trust (QQQ) has already made new highs and in Monday’s Viper ETF Report I am adjusting our strategy.
The Viper ETF Report and Viper Hot Stocks Report are typically sent out every Monday and Thursday. They include a detailed market commentary as well as specific recommendations.
The long positions established the day after the market low (Feb. 12th) have been working out well. The profits have already paid for a year of the Viper ETF or Hot Stocks Report and I hope you will consider a subscription.
Don’t Buy or Sell Based On Fears or Hopes - March 14, 2018
As I mentioned in the weekend article (Another Bear Trap?) the high level of fear going into the February 9th lows caused some investors to sell their long positions near the lows.
As the market rebounded many reacted emotionally as they were looking for the rally to fail. As a result they established short stock or option positions as the market moved higher.
Many were likely forced to cover these positions in the last few days as the stock market moved sharply higher.
The pullback this week has so far been minor but it has been enough to convince some that the rally is already over.
This may be because some traders and investors use a fundamental or an undisciplined technical approach. Some use past earnings or a company’s guidance to determine their investment stance but I prefer hard market data.
That is why I have confidence in technical analysis as it uses price and volume to determine one’s market view. It also allows one to determine the price levels where the market send you a message that your analysis is wrong.
Teaching investors or traders, as well as providing specific recommendations, is a major focus of both the Viper ETF Report and Viper Hot Stocks Report.
It is my hope that my clients will learn how to develop a disciplined approach to the markets. This will help them react objectively, not emotionally to any market action.

My current view is that this week's pullback is just a pause after last week's rally. A positive close on Thursday and/or Friday will shift the focus back on the upside as we have open orders to buy on a slight correction.
In each issue of both the Viper ETF Report and Viper Hot Stocks Report there is a review of the major market averages as well as the overnight action.
This analysis then determines my specific recommendations for ETFs and stocks.
The reports are sent out twice each week and market updates are sent out when the market is moving sharply.
Understanding Bear & Bull Traps - March 11, 2018

As expected last week the small caps outperformed the S&P 500 and Dow last week as the relative performance analysis last week signaled that IWM was becoming a market leader.
In this weekend’s article Another Bear Trap? I share my opinion that the decline from the January highs and the rally from the February 9th lows created a bear trap.
“The role of a bear trap is to convince many investors that the stock market is going to go even lower. Investors are scared out of their stock positions on a sharp market drop and some are convinced to go short, only to have the market reverse course and move sharply higher.”
Last week’s powerful gains supports this view as the IWM and QQQ were both up over 4%.
Of course there can also be bull traps where traders and investors are lured into buying stocks only to have the stock market collapse.
A bull trap occurred in July 2015 as the PowerShares QQQ Trust (QQQ) broke out to the upside (point 1) as the resistance at line a, was overcome. The FANG stocks were the big leaders.
The Nasdaq 100 A/D line just rallied back to its downtrend, line b, on the breakout (point 2). The downtrend in the A/D line as prices were moving higher created a bearish divergence.
This was a sign of weakness as I pointed this out in Forbes at the time “Narrow Advance Warrants Caution.”
Stocks drifted lower for the next six weeks before plunging on August 24th when the QQQ dropped over 18% in early trading.
Once again my A/D analysis warned in advance of this plunge. This analysis is updated twice a week in both the Viper ETF Report and Viper Hot Stocks Report.
Each service includes detailed detailed market commentary and specific recommendations.
The reports are sent out twice each week and market updates are sent out when the market is moving sharply.
Each report is only $34.95 per month and can be canceled online at any time. This is just over $4 per report.
Be Sure You Pick The Right Sector - March 7th, 2018

The Nor’easter hit us hard last week as we were without power or internet for several days. That is why we have not sent any emails recently. A new storm is now hitting us so I am sending this out earlier in the day.
The tariff announcement has certainly stalled the stock market rally. The volatility has been high and as I commented in a recent article it is likely to stay.
Even though the V-shaped market bottom has not been completed there is no change in the positive intermediate term stock market outlook based on the weekly A/D lines.
The trading is likely to be choppy for some time and another wave of selling could hit once the tariffs are finalized.

In today’s article Is It Time To Rotate Into Small Cap Stocks? I discuss how the relative performance analysis for the small cap Russell 2000 now indicates they are going to lead the large cap stocks.
Being in those ETFs or stocks that are leading the market is essential if you are going to make money in the stock market. The IWM outperformed again on Wednesday despite the market's early decline.
In December 2017 there was evidence that the QQQ would outperform the SPY so it was recommended to Viper ETF investors and traders. In 2017 the QQQ was up 32.6% while the SPY was up 21.7%.
The relative performance plays a key role in my stock and ETF selections process and I hope you will consider either the Viper ETF Report or Viper Hot Stocks Report.
Each service includes detailed commentary on the major averages along with my unique A/D line analysis and specific recommendations.
The reports are sent out twice each week and market updates are sent out when the market is moving sharply.
Each report is only $34.95 per month and can be canceled online at any time.
As a bonus to new subscribers to either premium service you will also receive the following five trading lessons.
- Managing Risk & Profiting With Starc Bands
- The Most Profitable Candle Formations
- Quarterly Pivot Levels For Trend Analysis
- A Simple But Valuable Tool
- Volume Precedes Price
Best regards,

Tom
Are The Market Bears Still Holding On? - Feb. 25, 2018

It was clear last week that volatility has returned to the financial markets. The late day reversal Wednesday in reaction to the FOMC minutes gave hope to those who were looking for a rally failure.
Those on the short side were also encouraged after stock’s closed weak on Thursday.

It was certainly a different story on Friday as the market was sharply higher and the A/D numbers were bullish as I Tweeted on Friday afternoon.
This is what I discuss in my weekend article “Are The Stock Market Bulls Winning?”
As I mentioned in Thursday's email “The A/D lines are still positive but need another strong day of advances over declines on Friday to project higher prices for next week.” We got that on Friday
The V-shaped market bottom I was discussing as a possibility at the market lows is now looking more likely.
Longs in the QQQ established by Viper ETF investors and traders at the open on February 12th are already up 6.6%.
If you are interested in specific buy and sell advice based on an objective and systematic approach I hope you will consider either the Viper ETF Report or Viper Hot Stocks Report.
Each service includes detailed commentary on the major averages along with my unique A/D line analysis and specific recommendations.
The reports are sent out twice each week and market updates are sent out when the market is moving sharply.
During the market plunge there was an update every day in order to keep my clients in touch with the markets.
Each report is only $34.95 per month and can be canceled online at any time.
As a bonus new subscribers to either service will also receive the following five trading lessons.
- Managing Risk & Profiting With Starc Bands
- The Most Profitable Candle Formations
- Quarterly Pivot Levels For Trend Analysis
- A Simple But Valuable Tool
- Volume Precedes Price
When To Sell or Hold? - February 22, 2018
As the stock market heads into the close on Thursday the major averages like the Dow Industrials and S&P 500 are still lower for the week.
The A/D lines are still positive but need another strong day of advances over declines on Friday to project higher prices for next week.
A majority of the ETFs are likely to stay above their QPivots this week as I discussed in the last email.
When you buy a stock or ETF it is often a tough decision on whether you should sell or stay with the position.
These two examples from the Viper Hot Stocks Report might help you understand how I handle this question.

CyberArk Software (CYRB) was recommended on Monday Feb. 12 but unfortunately only our first buy level at $43.82 was hit as we were trying to buy more at $43.14 but the low was $43.26.
The buy recommendation was based on the positive weekly chart but the daily chart shows that the relative performance had completed its bottom by moving above resistance at line b.
The daily OBV was also positive and indicated that the stock was being accumulated. CYBR rallied nicely the day after it was recommended and then broke its downtrend (line a). It then accelerated to the upside
I recommended selling it this morning at $49.34 or better and CYBR actually hit $50.
Though there are no signs of a top taking a 12.6% profit in just seven trading days I felt was a prudent move. I can always re-buy after a pullback.

I stay with some of my recommendations much longer like AMN Healthcare Service (AMN). It was originally recommended on November 20th as I thought it was going to break out of its trading range.
Only the first buy level at $43.96 was hit. Just a week later it did overcome resistance and hit $51.75 by the end of the month.
For all of December and a good part of January AMN stayed in a tight range so on January 9th I added to the position at $49.20.
The average cost was therefore $46.58 and my target from the trading range was in the $55-$57 area.
Last Friday I sold 50% at $57.64 for a 23.7% profit. I raised the stop on the remaining position and will hold the remaining position until there are signs of a top.
So why did I not sell AMN in December? Though AMN was not moving higher it had also not done anything negative so there was no reason for me to sell.
Of course not all trades are profitable as some are stopped out. I do close out other positions for a small profit or loss if they do not act well.
On Wednesday I shared my analysis of the drop in Walmart stock “What Do the Charts Say About Walmart's Drop?” I hope you enjoy it.
If you are interested in specific buy and sell advice based on an objective and systematic approach I hope you will consider either the Viper ETF Report or Viper Hot Stocks Report.
Each service includes detailed commentary on the major averages along with my unique A/D line analysis and specific recommendations.
The reports are sent out twice each week and market updates are sent out when the market is moving sharply.
During the market plunge there was an update every day in order to keep my clients in touch with the markets.
Each report is only $34.95 per month and can be canceled online at any time.
As a bonus new subscribers to either service will receive the following five trading lessons.
- Managing Risk & Profiting With Starc Bands
- The Most Profitable Candle Formations
- Quarterly Pivot Levels For Trend Analysis
- A Simple But Valuable Tool
- Volume Precedes Price
This Week’s Action Could Be Pivotal - February 18, 20018

Last week was a record-breaking one for the stock market as it relieved the stress of many investors and traders who had been panicking the previous week.
There were solid gains across the board though the selling late Friday did make some nervous.
There were a number of positive signs last week.

It was important that the weekly NYSE A/D line moved back above its WMA last week. This is often a sign that the correction is over.
All of the daily A/D lines have also moved back above their WMAs and are no longer in the corrective mode.
Many ETFs, like SPY, closed the week back above their QPivots which reversed the negative signals from the prior week.
I am attaching the Viper ETF Monitored List that was sent out to Viper ETF subscribers on Sunday morning. Those ETFs that reversed to positive are highlighted in green.
The table also includes the weekly starc bands that can help you determine when a market is in a high or low risk buy area.
In the weekend article “Are We Witnessing A V-Shaped Stock Market Bottom?” I share my analysis of the key markets.
A pullback or some consolidation is likely early this week. It will be important to watch the A/D numbers for any hints that heavier selling is developing. (Follow me on Twitter)
A minor pullback and then further strength will support the view of a V shaped bottom which would surprise the majority. There should be a good buying opportunity this week.
Many who followed my warnings of the high market risk in January have been able to get back into the market at lower prices.
If you are interested in specific buy and sell advice based on objective data I hope you will consider either the Viper ETF Report or Viper Hot Stocks Report.
Each service includes detailed commentary on the major averages along with my unique A/D line analysis and specific recommendations.
Is A V-Shaped Bottom In Place? - February 15, 2018

In last weekend’s article I raised the possibility that we could form a rare V-shaped bottom like we did in October 2014.
In Sunday’s email I told you “I will be watching the overnight action and if no heavy selling I will be recommending new long ETF and stock positions."
Monday’s overnight action was strong and Viper ETF investors and traders were given buy advice in the QQQ, IWM, VFH, XLY, XLK, VWO and EWZ.
Several new stocks were also recommended to Viper Hot Stocks traders including CyberArk Software (CYBR) which was up 7.5% Thursday on strong earnings.

In this morning’s reports I discussed this chart of the PowerShares QQQ Trust (QQQ) and the fact that the Nasdaq 100 A/D line had moved back above its WMA. This indicates that the correction is over.
The QQQ has gained another 1.8% Thursday as it is up sharply from Monday’s open. The S&P 500 was up 32.5 points or 1.21% on Thursday while the Dow Industrials gained another 306 points or 1.2%.
In this afternoon’s column “Don't Get Fooled By The Monthly Reports” I commented on the fact that “many stock investors and traders avoided buying stocks ahead of January's CPI report, released yesterday. Fears that the CPI number would be higher than expected had some convinced that last week’s market selling could resume.”
In the article I explain why I think changing your strategy because of one economic report is a mistake. In addition I explain how I analyze the economic data.
If you are frustrated that the conventional market approach is not working for you I hope you will consider either the Viper ETF Report or Viper Hot Stocks Report.
Each service includes detailed commentary on the major averages and their A/D lines along with my specific recommendations.
Our reports are sent out twice each week and market updates are sent out when the market is moving sharply.
Are the Wall Street Strategists Finally Right? - Feb. 11, 2018

In the weekend article I discuss the reasons why I am not that bearish after last week’s action.
I also review some of the past sharp market declines so those who have not been in the market for many years can gain some perspective.
I sent out updates to subscribers to the Viper ETF or Viper Hot Stocks Report every day last week as I wanted to share my market analysis with such a turbulent market.

Also in the article I again raise the possibility that we could form a rare V-shaped bottom like we did in October 2014.
The A/D line analysis turned positive soon after the lows and the PowerShares QQQ Trust (QQQ) was quickly making new highs.
Of course I will be watching the overnight action and if no heavy selling emerges I will be recommending new long ETF and stock positions.
I hope you will consider trying the Viper ETF Report or Viper Hot Stocks Report as they include detailed commentary on the major averages and their A/D lines along with my specific recommendations.
Our reports are sent out twice each week and market updates are sent out when the market is moving sharply.
Now Watch The Stock Market Rebound - February 6, 2018

I told subscribers to the Viper ETF or Viper Hot Stocks Report before the open Tuesday to cancel any stops as I thought the market was close to rebounding.
I did not want them to be stopped out on any early panic selling.
This was due in part to very high ARMS Index. This was the indicator that I mentioned in Sunday morning’s email.
Today the A/D numbers were slightly negative around lunch time but then reversed to positive setting the stage for the market’s strong close.
Market Update – February 6, 2018 8:02 AM
The stock market doubled its daily losses just after 300 PM and it was not surprising that the selling has continued in Asia and the Euro zone on Tuesday. The sharper selling, in my opinion, was likely triggered by the blowup of some low volatility ETNs and/or margin calls for some hedge funds. We may never get a definitive answer.
Even though the selling was much heavier than I expected it does not alter my positive intermediate-term view of the stock market and the economy. It does make things more difficult as many ETFs have dropped through some key levels of support.

The ARMS Index or TRIN closed Monday at 3.60 which was the highest reading since the summer of 2015. Though it sometimes coincides with an actual market low it often comes before the major averages hit their lowest level. Last year’s articleAvoiding Panic Sell Offs will give you some historical perspective on how this indicator works. The NYSE has quarterly pivot support at 12,366. (Editor’s note: The low Tuesday was 12,337)
Though V shaped bottoms are quite rare and harder to time technically we could see one this year. It is important to note that the ARMs Index readings need to be confirmed by the A/D lines which are showing no signs yet of a bottom. The NYSE McClellan oscillator closed Monday at -376 and is very oversold. It would take a sharp rebound in the Osc and then another decline before a short-term bottom could be formed.
So what’s next? I will be watching the rebound closely for signs that the worst of the selling is over as I am starting to target new buy levels.
Both the Viper ETF Report and Viper Hot Stocks Report include detailed commentary on the major averages and their A/D lines along with my recommendations.
Our reports are sent out twice each week and market updates are sent out when the market is moving sharply.
Each report is only $34.95 per month and can be cancelled online at any time.
As a bonus new subscribers to either service will receive the following five trading lessons.
-
Managing Risk & Profiting With Starc Bands
-
The Most Profitable Candle Formations
-
Quarterly Pivot Levels For Trend Analysis
-
A Simple But Valuable Tool
-
Volume Precedes Price
Is The Stock Market Now On Thin Ice? - - February 4, 2018

Because of the market’s sharp drop last week I wanted to send you my comments Sunday morning instead of in the evening.
I also wanted to welcome new subscribers to the free Viper Report emails. They are generally sent out twice a week as I hope to share my methods of analysis through the brief technical reports and market commentary. This updates I hope will help you decide whether you can benefit from either my Viper ETF or Viper Hot Stocks Report.
Since I think it is important to have some historical perspective I have included the first section of my weekend article “ Is The Market Now On Thin Ice?

The sharp drop in the major averages Friday added to the week’s woes, as the Dow Industrials was down over 4% and the S&P 500 lost 3.9% for the week. All eleven S&P sectors were lower. The relentless selling was evident from the weekly NYSE A/D numbers, as only 283 stocks advanced and 2821 declined.
After last week, many investors are likely to be on edge, especially those who just got into the stock market this year. Even the Super Bowl weekend is unlikely to keep many from worrying about the stock market. It is too early to tell how many of the new buyers will exit the stock market, but I would urge them to view last week’s action from a historical perspective.
It is important to understand that the stock market’s performance in 2017 and early 2018 has not been normal. In “Bulls Stampeding – What’s Your Strategy”, I pointed out that there had been only three times, 1965, 1994 and 1996 when the S&P has gone 370 days without a meaningful correction. The winning streak in 2017 and 2018 has been much longer, so last week's correction was not surprising.
As we started the year it seems many new investors were expecting that with the tax cut and booming economy that 2018 was going to be another buy-and-hold year. From my historical perspective, that was going to be unlikely, as I discussed in “Investing Or Trading In 2018?”. I thought 2018 was more likely to be a more volatile year. The action last week supports that view.
Most are blaming the market’s plunge on fears of a “bond bear market” as the spurt in wage inflation Friday caused another surge in yields, giving bond holders a new reason not to like bonds. Many investors still think rising rates must be bad for stocks and ignore the evidence to the contrary.

This chart of the yield on 10 Year T-Notes (in pink) and the S&P 500 (in blue) goes back to 1998. I think it is helpful to view the current action in terms of the past activity. The yield on the 10 Year T-Note has risen from a low of 1.458% in June 2016 to the current yield of 2.854%.
In September 1998 the yield had a low of 4.41% and by January 2000 it had risen to 6.67% (line 1). During that same period, the S&P 500 rose from 957 to 1517, a gain of 59.5%. The 2.26 percentage point increase in yields took 16 months from bottom to top then, and it has now been 20 months since yields bottomed in 2016.
In 2004, the Fed also started raising rates (line 2), and from a low of 3.35%, they peaked at 5.138% in May 2006. Of course, the stock market continued to move higher until it topped in October 2007. From the chart, you will also notice that the long term downtrend for 10 Year T-Notes (line a) has now been broken. This is consistent with a potential reversal of the multi-year downtrend.
Many are fearing that yields will move above 3% and from a technical perspective that is likely, probably this year. If yields move above 3% there is strong yield resistance in the 3.30%-3.40% area. Since MIT offered a 100 year bond back in 2011, I have been concerned that many bond holders may not understand that a capital loss in their bonds could be much greater than their yield.
For those theorizing that bond yields are rising because of increased inflationary pressures (and not an ever-improving economy), the 5.8% drop in nickel and over 1% decline in gold futures last week must have been a surprise. With so many focused on fears of the bond bear market, the question must be asked: Where are the bond investors going to invest once they sell? It seems likely that some of the proceeds will flow into stocks.
For the rest of the article, including market commentary please continue here
The Viper ETF Report and Viper Hot Stocks Report include commentary on the major averages and their A/D lines along with my recommendations.
Our reports are sent out twice each week and market updates are sent out when the market is moving sharply.
Each report is only $34.95 per month and can be cancelled online at any time.
As a bonus new subscribers to either service will receive the following five trading lessons.
- Managing Risk & Profiting With Starc Bands
- The Most Profitable Candle Formations
- Quarterly Pivot Levels For Trend Analysis
- A Simple But Valuable Tool
- Volume Precedes Price
Are Davos Billionaires Also Too Bullish? - January 31st, 2018

The global bullishness on the stock market has been dampened slightly this week as the Dow Industrials dropped over 500 points from Monday’s open.
Given the relentless rally since the start of the year, this decline caught many by surprise.

The bullishness was apparently also overwhelming amongst the billionaires at Davos.
Scott Minerd, the chief investment officer of Guggenheim Partners which manages $242 billion commented “I am troubled by the euphoria” and this is “turning him cautious.”
Here are the comments sent out to Viper ETF Report and Viper Hot Stocks Report subscribers before the open on Tuesday.
Market Update – January 30, 2018
“Stocks had the biggest decline in over four months on Monday as the market internals were decidedly negative with just 557 stocks advancing on the NYSE while 2467 declined. The volume was almost 3-1 negative.
The overseas market have continued lower Tuesday as Japan’s Nikkei was down 1.4% and Hong Kong’s Hang Seng lost over 1%. The declines in the Euro zone markets are not as severe in early trading while the S&P futures are down 10-12 points a few hours before the open.
The NYSE A/D line has dropped below its WMA for the first time since November 16, 2017. The NYSE A/D line has major support at line b.
The Russell 2000 A/D line is also now below its WMA while the other major A/D lines are still above the daily WMAs.
In yesterday’s report I noted the recent divergence in the number of NYSE stocks making new highs. On Monday the number of NYSE new lows surged to 204 which was the highest reading since November 14 of 2016.
There are no clear signs yet that a correction is now underway but how the market closes Tuesday relative to the open will tell us more. A weekly close in the SPY below $280 will indicate that the market is now ready to consolidate.”
The analysis of the A/D lines is a regular part of both my reports as it helped identify the stock market bottom in 2009 as well as the buying opportunity in early 2016.
On Sunday I discussed the decline in January 2014 that ended in a panic bottom in early February 2014 (see chart).

This chart shows that soon after the highs in January 2014 the NYSE A/D line had also dropped below its WMA, point 1.
From high to low the NYSE dropped 6.4% during the correction but soon after the low the A/D line signaled that it was the time to do new buying.
Though the major averages have rebounded on Wednesday it has not been strong enough to confirm that the market’s pullback is over.
In Thursday morning’s Viper ETF Report and Viper Hot Stocks Report I will have a full review of the major averages and their A/D lines as well as my recommendations.
Our reports are sent out twice each week and include specific recommendations with stops. Market updates are also sent out when warranted (like Tuesday)
Each report is only $34.95 per month and can be cancelled online at any time.
As a bonus new subscribers to either service will receive the following five trading lessons.
- Managing Risk & Profiting With Starc Bands
- The Most Profitable Candle Formations
- Quarterly Pivot Levels For Trend Analysis
- A Simple But Valuable Tool
- Volume Precedes Price
Don’t Let Fear or Greed Hurt Your Portfolio - Jan. 28, 2018

This cartoon in many respects reflects the swings in sentiment as well as the role that fear and greed play in the stock market.
Though it plays a role in the direction of stock it is often not easy for the investor or trader to recognize these extremes in sentiment.
In January and February 2016 the bullish % according to AAII hit the lowest levels since 2005. That combined with the positive technical signs indicated an important market bottom was forming.
There is one technical indicator, the ARMS Index, that does identify most panic selloffs.
It was developed by an old friend Richard Arms. I was fortunate enough to spend three weeks giving presentations throughout Asia with Dick and his wife.
Very high daily levels in the ARMS Index often identify days of panic selling. This indicator was discussed last year in Avoiding Panic Sell Offs.

There have been many sharp declines in this bull market like the one in early 2014. The S&P had dropped 6% since the start of the year and the selling accelerated in early February.
The February 3rd USA Today headline exclaimed “Dow tumbles 326 points” and they noted “investors were clearly afraid”.
The ARMS Index closed at 3.42 on February 3rd and most of the market averages made their lows in the next two days.
The S&P 500 rose over 8% in the next month but unfortunately many sold out on the lows and did not get back in the market.
In my weekend article The Week Ahead: Don’t Let The Euphoria Change Your Plan I urged investors and traders not to ignore the risk now that everyone is so bullish on stocks.
A poor entry price could hurt your portfolio once the market does correct.
Like the other corrections that have occurred in this bull market I expect the A/D line analysis to again warn me in advance of a correction.
As part of my methodical selection of ETFs and stocks to recommend in the Viper ETF Report and Viper Hot Stocks Report the potential risk is a primary concern.
If you are interested in learning more about trading and investing as well as risk analysis I hope you will consider one of my premium services.
Each report is only $34.95 per month and includes two reports each week with in-depth market analysis as well as specific recommendations.
As a bonus new subscribers to either service will receive the following five in-depth trading lessons.
- Managing Risk & Profiting With Starc Bands
- The Most Profitable Candle Formations
- Quarterly Pivot Levels For Trend Analysis
- A Simple But Valuable Tool
- Volume Precedes Price
Subscriptions can be cancelled online at any time.
The past free Viper Report emails are archived here.
Focus On The Entry Risk - January 24, 2018

In a recent email I discussed how I use pivot point analysis as well as other methods to determine entry and exit levels for my clients.
I have had the privilege of training students around the world and consistently have found that most investors and traders do not pay enough attention to the risk of their new investments.
Many investors will read about a company or see something on TV and decide to buy a stock. They do not pay any attention as to whether the stock is in a high or low risk buy area.

In the November 27th Viper Hot Stocks Report SS&C Technologies Holdings (SSNC) was a new buy recommendation as I commented that it “triggered a weekly doji buy signal on Friday” and was on my weekly scan buy list.
Prior to making any recommendation to my clients I look at the risk versus the reward of any new position.
SSNC had pulled 7.8% from the late October high and tested the 20 week EMA so it was not in a high risk buy area (chart on left)
Since it was near support I was willing to buy 50% just above the prior Friday close at $40.81 and 50% at $40.43 which was just above the prior week’s high at $40.32.
SSNC traded as low as $39.73 over the next month but held well above my stop at $38.81.
SS&C Technologies Holdings (SSNC) started off the New Year strong and it soared 12.8% on January 10th.
Viper traders were advised to sell on January 11th at the opening price of $48.97 for a profit of 22.8%. A stop at $47.47 is now being used to lock in a nice profit on the entire position.

SPDR S&P Pharmaceuticals (XPH) moved above the July high at $44.35 the week ending January 5th. The on-balance-volume (OBV) had broken out ahead of prices which occurs frequently.
On Monday January 8th Viper ETF traders were advised to buy the SPDR S&P Pharmaceuticals (XPH) at $44.48 or better and 50% at $43.88 with a stop at $41.88 (risk of 5.2%).
XPH dropped to a low of $43.48 which was just below the 20 day EMA but closed at $44.13. The next day it rallied sharply to confirm the bottom.
The position is already up 5% and because of the positive weekly indicators I will also now be looking to recommended XPH to investors.
In a future email I will be discussing the starc bands which are used to identify high and low risk entry points.
New subscribers will receive an in-depth trading lesson “Managing Risk & Profiting With Starc Bands”.
Risk/reward analysis plays an important role in both the Viper ETF Report and Viper Hot Stocks Report.
Once a position moves in our favor the stops are raised to reduce the initial risk.
If you are interested in learning more about trading and investing I hope you will try one of my premium services. I think you will be pleased with this investment.
Don’t Let The Euphoria Change Your Plan - January 15, 2018

It was another blockbuster week for the stock market as several ETFs like KRE I discussed last time were up 4-5%.
The first two weeks of 2018 have turbocharged the interest in the stock market which should be bullish for the intermediate term. However on a short term basis it can lead to disappointment.
In The Week Ahead: Investing Or Trading In 2018? I discussed the stock market performance in 2017 relative to other years in the bull market.
The lack of any correction last year has some traders wondering whether they should still trade.
In over 30 years of watching the market this change in sentiment makes it likely in my opinion that there will be more swings in 2018.
One client who just started investing in September (Correction Over — What & Where To Buy?) was so excited he wanted to get even more invested.
He wanted to know what he could buy now even though he had already met his yearly profit gains in just four months.

He was especially happy with his results in the energy sector ETFs as I was bullish in early September article when some TV analysts were looking for crude to drop below $40 but my OBV analysis had turned positive (see chart)
Crude closed Friday above $64 and I recently advised taking an 18% profit in the SPDR S&P Oil & Gas (XOP) but he was anxious to buy again.
I explained that there would be another opportunity but that I felt the risk was too high currently.

Of course the gains in individual stocks have been even greater as one of the Viper Hot Stock picks SS&C Technologies Holdings (SSNC) was up 12.8% on Wednesday on ten times the average volume.
Traders were advised to sell half their position on the open Thursday as they were long from $40.61.
Even though there were no signs that the stock could not go even higher by selling at $49.87 (Thur’s open) the 22.8% profit had already exceeded the goal from my original plan and I still had half the position.
So if you are feeling a bit too euphoric and are tempted to tell your friends or family about your gains – take some partial profits even there are no warning signs yet of a correction.
By following the analysis in the Viper ETF Report or the Viper Hot Stock Reports you will learn about the markets so you can avoid some investing and trading mistakes which will help you gain confidence.
By learning my methods you will be able to make your own decisions.
The Viper ETF Report and Viper Hot Stock Reports are only $34.95 per month and they can be cancelled online at any time.
Using Volume To Buy The Dips - January 10, 2018

When a market makes a sharp rally out of a base many investors and traders are left on the sidelines.
Such a rally is generally part of a more significant price increase but finding the next good entry requires patience and attention to the technical readings.

For example, Neftlix, Inc. (NFLX) bottomed out last July as it had dropped 13% from the June high at $166.87 and generated a daily doji buy signal on July 7th.
In just eleven days it rose above $188 as it moved above the daily starc+ bands which meant it was in a high risk buy area.
By the latter part of August NFLX had dropped down to the 50% retracement support of the rally at $167.99 where Viper Stock traders started buying.
The low at $164.23 was above the 61.8% Fibonacci support (see Trading lesson) and the 20 week EMA.
On August 30 (line 1) the OBV completed its bottom formation by moving above its WMA and the downtrend, line a.
On the pullback in late September the volume was light and our stop was not hit. It was placed to lock in a profit.
NFLX again started to move higher but profits were taken before they reported earnings on October 16th.
Though volume has been an important technical tool for many years many of the media analysts do not appear to use it when they make recommendations especially on ETFs.

On Monday I recommended that both investors and traders buy the SPDR S&P Regional Bank ETF (KRE)
The ETF had a large rally in late November as the volume surged as it peaked above the daily starc+ band.
In December and early January KRE traced out flag formation (lines a and b) which is one of my favorite and most profitable chart formations.
Last Thursday (1/4/18) the OBV turned bullish as the volume started to increase as it moved above its WMA (line 1)
On Monday KRE hit both of my recommended buy levels and in the past two days it has gained 4% from Monday’s low.
These are not isolated examples and I have been relying on the OBV since I first wrote about it in the late 1980’s. It is also an indicator you can follow on many free charting platforms.
The stock market looks ready to close lower on Wednesday for the first time in 2018.
I will be discussing today’s action in the Thursday’s Viper ETF Report and Viper Hot Stocks Report.
I do think that there are likely to be more market swings in 2018 so it will be important to have technical analysis on your side.
Each premium report is only $34.95 per month and they can be cancelled online at any time.
I will send out another update over the weekend.
The Viper Report free emails are archived here.
Bulls Stampeding -- What's Your Strategy? - January 8, 2018

This is the headline for my weekend article that was released on Saturday and here is the link.
In the article I look at two years when S&P 500 also went for over 370 days without a 5% correction – I think you will find the charts interesting.
Just a brief update tonight as I live in the frigid northeast and there is no fireplace in my office.
Sunday’s are a busy day for me as I am doing my research for Monday’s reports. I also send out special updates over the weekend.
Viper ETF subscribers Sunday received a list of over 8o ETFs that I monitor with their new 1st quarter pivot levels.
As I discussed last time they play an important role in my analysis.
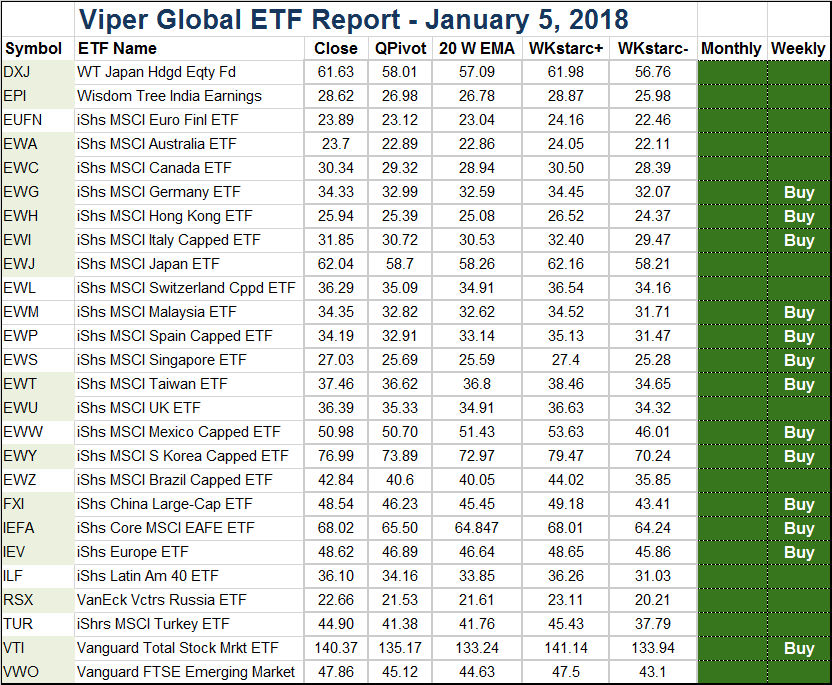
I also sent out the Viper ETF Global Report which updates the new weekly buy or sell signals and also includes the quarterly pivot levels for each global or country ETF as well as the starc bands.

As the charts indicate the WisdomTree Japan (DXJ) and iShares MSCI Canada (EWC) are two of the current global portfolio. They both accelerated to the upside last week.
I have attached today’s copy of the Viper ETF Global Report that I use to develop the specific recommendations for the Viper ETF Report. The entry level and stop are the keys to making money.
The Viper Hot Stocks Report subscribers also receive additional reports in addition to the regular reports sent out each Monday and Thursday.
I think I can help you be more successful in 2018 so I hope you will consider either the Viper ETF Report or the Viper Hot Stocks Report.
Each report is only $34.95 per month and can be cancelled online at any time.
I will send out another update during the week.
Best regards,

Tom
Taking The Emotion Out of Investing - January 3, 2018

The stock market sold off at the end of 2017 but has opened with a bang in 2018 as the S&P futures have recorded strong double digit gains.
As I mentioned before the holidays it was my view that the stock market had entered the euphoric period for the first time since the start of the bull market.
Throughout the seven year bull market I have continued to advise clients through my articles on Forbes that there were no signs of a recession or a bear market. Before either occurs there will be plenty of warning.
The stock market surprised the majority of analysts in 2017 as it closed well above their year-end targets.
Few of these “Wall Street experts” use an objective way to analyze the market’s trend but instead they try to guess the impact of legislation, global events or earnings on the stock market.
Too many investors and traders get emotionally involved in the markets and sell during a brief market decline only to miss the next rally.
One of the key indicators I use to measure the market’s trend is the quarterly pivot analysis which is based on the price ranges of the prior quarter.
As long as the market does not have a Friday close below its quarterly pivot then the trend remains positive. A Friday close above the quarterly pivot indicates a change in trend.

The chart of the PowerShares QQQ Trust (QQQ) shows that the week ending November 11, 2017 the QQQ closed back above its quarterly pivot (QPivot) at $113.23.
Since then the QQQ has not had a Friday close below its QPivot as at the end of 2016 (point 2) it closed weak at $117.42 but above the 4th quarter pivot.
The next week it closed at $120.83 which was well above the new QPivot at $117.82.
The QQQ peaked in June 2017 and then corrected until early July but did have a weekly close below the 3rd quarter pivot (point 3).
The QPivots as well as the support and resistance derived from the quarterly data play an important role in both the Viper ETF Report and the Viper Hot Stocks Report.
For example Viper Investors bought the Vanguard Energy ETF during the October pullback which held above the 3rd quarter pivot at $90.60. It closed today at $102.26.
If you are interested in learning more about the quarterly pivot analysis new subscribers to both the Viper ETF Report and theViper Hot Stocks Report will receive a Trading lesson that will explain it in even more detail.
I hope you will start off the New Year by joining one of our premium services as each report is only $34.95 per month and can be cancelled online at any time.
Best regards,
Tom
How Long Can the Euphoria Last? - December 17, 2017

This chart shows the various stages of investor psychology and in talkin
g to many investors over the past 35 years I would say it is often quite accurate.
For several years I have commented that the stock market had not yet entered the euphoric stage even though many continued to warn that it had lasted too long.
I think it has now entered this phase but in 1999 it lasted for over a year before the market peaked out. It can continue as long as the technical readings stay strong.
In January 2017 many were already warning about the stock market after the inauguration but I advised to “Wait For Signs Of A Trump Bear Market”.
In the article I commented that “I think there will be clear evidence before we see a Trump bear market or meaningful correction”.
My view of the market has not changed over the past year as there have been no signs of a significant correction since the January 2017 article.
chart.

In the weekend article “The Week Ahead: Can Stocks Move Even Higher In January?” I discuss the S&P 500’s seasonal trend using data going back to 1929 as well as what the outlook is for stocks in January.
I also advise that the market is unlikely to be as easy as it was in 2017 and that keeping track of the market’s trend will be essential in 2018.
Tom
Japan’s Gift To Investors - December 13, 2017

In 1989 I was giving a presentation in Tokyo when a client gave me a copy of the Japanese Chart of Charts by Sieki Shimizu. This was part of a five country Dow Jones tour that also visited South Korea, Taiwan, the Philippines and Hong Kong.
Candle charts soon became a part of my regular routine and there is one formation that I have found to be especially valuable.
A doji is formed when the open and closing price are roughly the same. These are more valid when they occur on monthly or weekly data.
After a protracted rally or decline the close outside of the doji price range generates a signal.

The chart shows that Apple Inc. (AAPL) formed a doji the week ending September 21, 2012 as it opened the week at $89.94 and closed at $90.04.
The next week (point 1) it closed at $85.80 which triggered a weekly doji sell signal. By April 2013 the stock had declined to just above $50 a share.
The doji buy and sell signals play an important role in both the Viper ETF Report and the Viper Hot Stocks Report.
In each Monday issue of the Viper Hot Stocks Report I list a number of the new weekly doji buy and sell signals.
New subscribers to either of my premium service receive the Trading Lesson – The Most Profitable Candle Formations.
In this eight page lesson I discuss the Apple trade as well as other examples of how I use this technical method.
Do You Have The Tools & Insights To Prosper In 2018? - Dec, 10, 2017
The stock market continued to move higher last week as the short term pullback from Monday’s high created a good buying opportunity. The stock market has been in a strong trend since September when the A/D lines entered the aggressive buy mode. This is noted on the chart below.

As a part of both the Viper ETF Report and the Viper Hot Stocks Report I use the A/D line analysis to identify those periods when one can buy aggressively as during these periods individual stocks can rise from 10-30%.
A broadly based ETF like the Spyder Trust (SPY) can rise 5-10% during these periods while a specific sector ETF can do even better.
As I explained in a March 2017 article “How To Keep Riding This Bull Market” I again commented how the “wall of worry” and the financial headlines have helped to keep many investors out of stocks.
Many investors and traders missed much of the stock market rally in 2017 but as I commented then
“The new all-time high by the A/D line in late November 2017 was a strong reason to be buying stocks on a correction or a period of consolidation. This was one of the factors why I was so convinced in December and January that stocks were going to move even higher. I urge you to start following the A/D lines at least on a weekly basis as it will keep you riding the bull market until it is over.”
In a previous email I pointed out how wrong the Wall Street strategists were in 2017 and I feel strongly than by following an objective technical approach like that of the Viper Reports you can do much better than them in 2018.
In addition to knowing when to buy my RS analysis will help you know what ETFs or stocks to buy to keep you ahead of the crowd in 2018.

In last Friday’s article “Is The Slide In Semiconductor Stocks Over?” I review the technical outlook for the high flying semiconductor ETF.
As of Friday’s close it looks like these stocks can decline further before they bottom out. I am looking for another good buying opportunity in these hot stocks and the action early in the week will be important. (You can also follow my analysis on Twitter)
My methods are more fully explained in my trading lessons.
New subscribers to either the Viper ETF Report or the Viper Hot Stocks Report will receive five additional trading lessons that will help you better understand the markets.
As part of each service I try to teach you about the markets through my comprehensive market updates twice each week.
The Entry Price Is Key To Success or Failure - Dec. 7, 2017

The bullishness from last week’s action set the stage for a wild open on Monday as the S&P futures gapped higher on Sunday night.
By the NY open Monday morning they traded as high as 2665.25 in the first 30 minutes of trading (see chart).
An hour later the futures were 15 points lower. Those who bought the open were quickly in trouble and things got even worse that night as they dropped below 2634.
The S&P futures have bounced Wednesday from the low at 2620 which was just below the monthly pivot at 2620.75.
The positive A/D numbers Thursday and the higher close suggest that the uptrend may be ready to resume.
For both the Viper ETF Report and the Viper Hot Stocks Report I use a combination of pivot points, Fibonacci and chart analysis to determine precise entry points where the risk can be controlled.

In Thursday’s Viper Hot Stocks Report I recommended IntercontinentalExchange (ICE).
The relative performance broke its downtrend, line a, in November. The OBV also completed its bottom by moving above resistance at line b. This was bullish and I was looking for a pullback to buy.
ICE hit a high of $72.99 Monday as it traded above the daily starc+ band and therefore was in a high risk buy area (point 1). It closed Wednesday at $70.74.
My advice was to buy 50% at $69.74 just below the 38.2% support and a bit above the monthly pivot at $69.50.
The second 50% buy was at $69.31, just above the 20 day EMA at $69.20 and the 50% support at $68.95.
ICE opened today at $70.48 and traded as low as $69.30 before closing at $70.39.
Both buy levels were therefore hit and though the position now has a slight profit a further rally is needed to indicate that the correction is really over
These methods are discussed further in the attached Trading Lesson – Finding the Best Entry Levels.
New subscribers to either the Viper ETF Report or the Viper Hot Stocks Report will receive five additional trading lessons that will help you better understand the markets.
Is A Bear Market On The Horizon? -December 3, 2017

In the first of this weekend’s Forbes articles “The Week Ahead: How High Can The Market Forecasts Go?” I discuss some of the methods that I use to forecast price targets when averages are making new highs.

I also discuss how the NYSE A/D analysis identified the 2003-2007 bull market and warned of the bear market in 2008 as shown in this chart.
Similar signals were evident for bull markets over the past 50 years.
In the second article I take a look at the technical outlook for the stock market after last week’s action “Charts For The Week Ahead”.
From the A/D line analysis it is clear that there is no bear market on the horizon. I feel confident that the A/D line analysis will warn you in advance about the next bear market.
A short email today as I had a major computer failure on Sunday. I hope you enjoy the articles.
If you are interested in specific buy and sell advice with precise stops to limit the risk I hope you will consider either the Viper ETF Report or the Viper Hot Stocks Report .
Should You Count On Wall Street Forecasts? - November 26, 2017

The very strong market action last week caused the bullish % in the AAII survey to jump 6.1% as it had dropped 15% the previous week.
The bullish % typically is at 50% or more before a significant top so there is room for further improvement.
The stock market’s strong gains likely got some investors attention. Some may be looking to the Wall Street strategists for guidance on how they should invest in 2018.

The data from the recent Bloomberg article indicates that following their price forecast would be a mistake. Since 1999 they have never predicted a down year.
The S&P is currently trading over 150 points above their consensus target of 2445 as they were too bearish all year.
Listening to their bullish calls during 2000-2002 would have resulted in half your investment being lost.
My market analysis shows no signs of a recession or a bear market. This has been the case throughout 2017.
In addition to being right about the market’s direction it is important to have a systematic method to find which market sectors are going to perform the best.

In each Monday’s issue of the Viper ETF Report I provide a table like the one above from Monday November 20th.
In addition to the weekly data I also review the analysis of the relative performance (RS) and on balance volume (OBV).
The table shows new positive signals in the small cap iShares Russell 2000 (IWM) (highlighted in green). It was a market leader last week gaining 1.76%.
If you are interested in specific buy and sell advice with precise stops to limit the risk I hope you will consider either theViper ETF Report or the Viper Hot Stocks Report .
As part of each service I try to teach you about the markets through my comprehensive market updates twice each week.
The services are only $34.95 each per month and can be cancelled online at any time.
Has Sentiment Turned Negative Enough? - November 19, 2017
Since the October highs most of the major average have held near the highs. During this period some sectors have had corrections of 4-6%.

In last week’s survey the individual investors in the AAII survey became much less positive on the market as the bullish % dropped 15%.
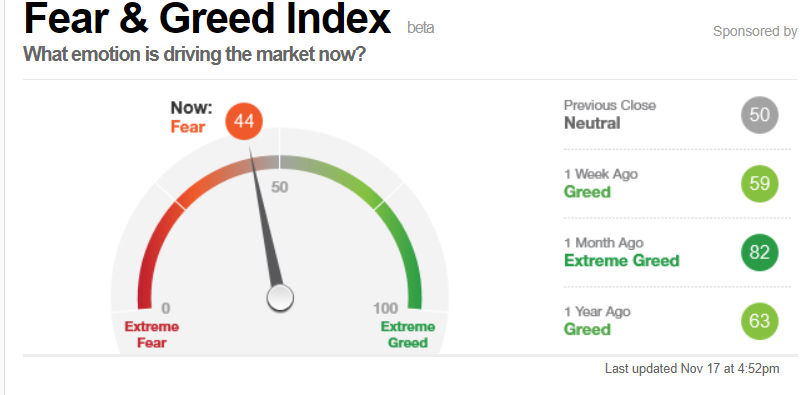
The CNN Fear & Greed Index was 82 a month ago which was well in greed territory. It closed last week at 44 and is now well in fear territory.
These are signs that the bullish sentiment may be low enough to move the market even higher.
My analysis of the A/D lines has kept me on the right side of the market since the 2009 lows.
Over the past four weeks it was indicating that we would see an overall market correction or a pause in the uptrend.
The Nasdaq 100 A/D line made a new high last Thursday which has improved the technical outlook as it had been diverging from prices.
The positive action last week in two of the correcting sectors indicates they are now ready to move higher.
The seasonal trend for stocks this week and for December is very positive.
This allows for a year –end rally. A higher close this week will further support this view.
In the latest Week Ahead article I discuss the economic data that has been indicating a strong and improving economy. In it I show you how to analyze some of the key economic reports which show no signs yet of a recession.
If you are interested in specific buy and sell advice with precise stops to limit risk I hope you will consider either theViper ETF Report or the Viper Hot Stocks Report.
As part of each service I try to teach you about the markets through my comprehensive market updates twice each week.
The services are only $34.95 each per month and can be cancelled online at any time.
Because of the holiday there will not be a mid-week update.
I hope you all have a happy holiday with your family and friends.
Are You In This Market Leading Sector? - November 14, 2017
Since last week’s Watch For Signs Of A November Correction there have been more signs of deterioration. The NYSE Composite, Dow Industrials and S&P 500 were lower on Tuesday for the third time in four sessions. All did close well above the day’s lows.

In fact on Tuesday the Utilities Sector Select (XLU) was one of the few positive sectors closing at $56.88, up 1.2% for the day. Viper ETF Investors are long from $48.95. It also yields 3% and has paid two dividends since purchase,
One of the key technical tools that I use to select the best performing ETFs and stocks is the relative performance (RS) analysis.
For investors the Viper ETF Report looks to go long when there are signs from the RS analysis that a bottom is in place. Longs are held until there are signs that the weekly trend is changing. For traders a more active strategy is used.
In my article How To Identify Sector ETFs Before They Make Big Moves I explain how I use this analysis.
In early October’s “Don't Make These Two Investing Mistakes Now” I pointed out that the RS analysis of General Electric (GE) has been negative since the start of the year which meant that the stock should be avoided.
The company has been in the news all week as they cut their dividend on Monday and lost another 6% on Tuesday.
The internal market strength has deteriorated this week and on Tuesday the number of NYSE stocks making new lows looks ready to jump to 126. This would be the highest level since the early August correction.
Will Today’s Close Be Important? - November 9, 2017

Stocks have edged higher so far this week but the stock index futures are set to gap lower on the opening Thursday morning.
The S&P 500 and Nasdaq 100 A/D lines have not made new highs with the averages but these negative divergences have not yet been confirmed.
Of course it is the closing price not the open that is really important in determining the market’s trend as even if the futures open lower they can still close the day higher.
In yesterday’s article Watch For Signs Of A November Correction I explain what signs I am looking for to signal that the market is ready to correct.

The updated chart of the PowwerShares QQQ Rust (QQQ) shows the divergence in the Nasdaq 100 A/D line and the important support level that I am watching.
Until the A/D lines enter the corrective mode the market’s trend remains positive. That is why I suggests you follow the advance/decline data each day when these divergence develop.
Throughout the bull market I have correctly warned clients of corrections and issued major buy recommendations at the important market bottoms in 2010, 2011 and 2016.
I hope you will find this article helpful as one of the goals of both the Viper ETF Report or the Viper Hot Stocks Report is to educate my readers.
The Importance of Volume - November 5, 2017
The earnings from Apple Inc. (AAPL) helped to push the market even higher on Friday. The tech heavy Nasdaq 100 managed a 1.3% gain as it led the market higher. The Dow Industrials were up 0.45% while the S&P 500 gained only 0.26% but both made new highs.
The Dow Transports were down 1.78% while the small cap Russell 2000 lost 0.89%. There were actually 41 more NYSE stocks declining than advancing last week. The prior week the weekly NYSE A/D numbers were also negative.
Just a brief update tonight but I will be publishing a full technical review of the markets early next week. In today’s comments I would again like to emphasize the importance of volume in understanding the markets.
To help you understand I have attached one of the Trading Lessons “Volume Precedes Price” that I previously sent to my premium clients as part of their subscription.
The energy ETFs were one of the best performing sectors last week as the SPDR S&P Oil & Gas (XOP) was up 5.8%.
The on-balance volume (OBV) is my favorite volume indicator and I have been using it successfully for over 30 years.

The daily chart shows that the OBV broke out of a base formation in early September as it moved through month long resistance.
Long positions were established at two different levels with an average price of $30.14. Just over two weeks later I recommended taking a 10% profit at $33.33.
As it turned out XOP moved higher for a few more days before it topped out. My weekly analysis did indicate that a pullback would be a buying opportunity.
New longs were established during the correction but the second position went against us for a few days before XOP finally bottomed out.
Investors were advised to buy the Vanguard Energy ETF (VDE) on the pullback and last week’s action confirmed the bottom in the weekly indicators.
The OBV can be followed on several free platforms and I hope you will take the time to read the Trading Lesson as I think your understanding of the markets will benefit.
I use it along with the relative performance analysis to guide most of my recommendations.
When Was The Last Real November Correction? - November 2, 2017

In a late Thursday afternoon announcement Jerome Powell was nominated to be the next Chair of the Federal Reserve. I think the market would have preferred that Janet Yellen got another term.
I am very happy that John Taylor wasn’t selected as I think it would have been negative for both the markets and the economy.

As the stock market has powered to new highs as the bullish sentiment continues to grow. Now the individual investors are finally turning bullish.
The bullish % rose 5.4% in the today’s AAII survey to 45.1%. This is the highest bullish reading since early January.
As many of you now this is often referred to as a contrary indicator as historically these investors are too bullish at market tops and too bearish at market bottoms. The sentiment readings must coincide with technical readings before any action is taken.
That was the case in February of 2016 “The Week Ahead: Is There Blood In The Streets Yet?“ when the bullish sentiment hit historically low levels and the technical indicators had bottomed. The S&P 500 is up 53% since those lows.
In Wednesday’s article “When Was The Last Real November Correction?” I discussed the historically strong performance of the stock market in November going back to 1950. My examination of two past November corrections identified the warning signals that investors and traders should recognize.
The market managed to close mostly higher on Thursday though some market averages were lower. The advancing and declining stocks were about even Thursday and there are some early warning signs from my advance/decline analysis.
This makes it possible that the market will move into the corrective mode in the next few weeks. If this occurs the market will enter a more difficult period which with correct timing should lead to a good buying opportunity.
In my Viper ETF Report and the Viper Hot Stocks Report I share my A/D analysis twice each week and give specific buy and sell advice.
Each service is only $34.95 per month and can be cancelled on line at any time.
In addition to providing timely advice on both stocks and ETFs I also teach my subscribers about the markets. I hope you will consider one of my premium services.
Best regards,
Tom
Don’t Get Gored When The Bulls Are Charging - October 22, 2017

The powerful rally in several of the best known technology stocks got the market’s attention on Friday. The enthusiasm for the stock market was quite high all week and most analysts in the financial media were quite bullish.

The CNN Fear & Greed Index has fluctuated between being well in the Greed territory at 73 on Friday and being in theextreme Greed territory at +89 a week ago.
Of course that is not too surprising since the Spyder Trust (SPY) is up 5% since Labor Day.

This is quite different from the market sentiment two months ago when the S&P 500 advance/decline line broke through its downtrend, line a, confirming that the stock market had bottomed.
I noted in the September 3rd Viper Report email “Correction Over – ETFs, Stocks or Both?” all of the A/D lines had moved out of the corrective mode the previous week.
The survey from the American Association of Individual Investors revealed that only 25% of individual investors were bullish.
The stock market moved sideways for the next week and the CNN Fear & Greed Index dropped to 38. The technical outlook was still very positive and I advised Viper Report subscribers that patience was required.
When the stock market is just completing its correction there are good buying opportunities as the risk can be better controlled and the profit potential is greater.
After the market has rallied for six to eight weeks one has to be a more cautious buyer.
There are still a number of stocks that have not moved higher with the stock market and are not overextended. Double digit profits were taken on three of our long positions last week.
This same sort of risk analysis is applied to the stock selection in the Viper Hot Stocks Report. In Monday’s report there is one new long and two new short stock recommendations.
In Friday’s article “A New Way To Analyze Risk” I discuss how the use of one of my favorite technical indicators can determine high and low risk times to buy or sell.
Many of the ETFs that I follow for the Viper ETF Report have had very nice price moves since the September lows but several ETFs are just bottoming.
If you are looking for specific buy and sell recommendations I hope you will consider either the Viper ETF Report orthe Viper Hot Stocks Report which are my premium services. With each you receive detailed market analysis twice a week.
Each service is only $34.95 per month and can be cancelled online at any time.
Best regards,
Tom
Smart Scanning Is Essential - October 22, 2017


In my mentoring classes I teach student first on how to use and interpret the key technical studies that I use including relative performance and on-balance-volume. Then I share some of the methods I use to enter and exit positions as well as how to place stops in a unique way.
This knowledge is what I feel they need in order to execute investments or trades that have a higher probability of success. Once these students are competent in these methods I then discuss why scanning can be such an important part of being successful in the markets.
For the Viper Hot Stocks Report I scan the Nasdaq 100 as well as an expanded list similar to the IBD Top 50. The weekly buy and sell candidates are then examined closely on both a weekly as well as daily basis to generate new recommendations for Monday’s report.
I look not only at the multiple time frames using my key indicators but also what is the potential risk as well as the reward for each position. Of course scans are also run on approximately 100 ETFs that I follow on a regular basis forthe Viper ETF Report.
In the past few weeks I have started sending the weekly scans of the S&P 500 stocks to Viper Hot Stock subscribers over the weekend as not all of these stocks are included in my regular scans.
I have attached the weekly scan results for the S&P 500 as of Friday’s close and I hope you will take a look.
I posted two articles over the weekend in the first Chart Warnings For Two Tech Giants I discuss the prospects for two tech giants which both report earnings on Thursday. There are some signs for these stocks that are similar to those forNeflix (NFLX) which I was happy to sell before earnings.
On Saturday I also posted a review of the past week in the markets The Week Ahead Market Wrap. I hope you enjoy both new articles.
If you would like to see if you can benefit from my scans and technical methods I hope you will consider either theViper ETF Report or the Viper Hot Stocks Report.
I provide detailed market analysis twice a week in each report with specific buy and sell recommendations.
Each service is only $34.95 per month and can be cancelled on line at any time.
Best regards
Tom
Dow Over 23,000 – Should You Jump In? - October 18, 2017

The ability of the Dow Industrial Average to close above 23,000 brought out a new set of hats on the NYSE Stock exchange and the commentary this week may have convinced the most skeptical investor to buy.
One trader commented that “everything is different now” which believe me is never a good sign. Now when that is the universal opinion I will be very worried but it does make me cautious at current levels even though the major averages could easily add another few percentage points.
In todays article “One Dow Leader Topping Out — Who Is Next?” I pointed out the fact that some stocks like Neflix (NFX) and Goldman Sachs (GS) were weak after their earnings reports. My concern is that this is going to be a trend and if some of the Dow leaders are hit the selling could increase and that will be the new headline.
Therefore I would not recommend that anyone jump in at current levels in the major averages. I do expect some stocks to hold up well and even move higher when the market corrects but one needs to pick their buy levels carefully.
We have been taking profits in the Viper hot Stocks as detailed below.


Applied Materials (AMAT) Traders were 50% long at an average price of $44.47 and sold at $54.64 for a 22.8% profit. Sold 50% earlier for a 10.6% profit.
Netflix, Inc. (NFLX) Traders were 50% long at an average price of $168.28 and sold longs at $202.34 for a 20% profit.
PRA Health Sciences (PRAH) Traders were 50% long at $75.92 and sold on the open Monday at $83.73 for a 10.3% profit. Will look for a new entry.
I posted the free Viper Report emails here since the September lows if you would like to take a look.
The Viper ETF Report and the Viper Hot Stocks Report provide detailed market analysis with a disciplined approach to generate specific buy and sell recommendations. I hope you will consider either the Viper ETF Report or the Viper Hot Stocks Report.
Each service is only $34.95 per month and can be cancelled on line at any time.
Best regards
Tom
Will Earnings Match Expectations? - October 15, 2017

The earnings season got started last week and two of the big banks Citigroup (C ) and Wells Fargo (WFC) disappointed investors as they were lower on heavy volume. Prior to the earnings I had argued that those with nice profits should get out of part or all their positions before earnings.
During earning’s season this is a regular discussion I have with Viper Hot Stock Traders as I discuss the strategy ahead of earnings. Sometimes I will avoid recommending stocks before their earning but not always.

If APPL dropped on earnings I wanted to be a buyer so the risk could be controlled but instead it declined before the close and its earnings report.
My recommendation was go 50% long at $11 0.72 and 50% at $108.58 with a stop at $103.89 (risk of 5.2%).
Option traders should buy the March $105 at $8.88 or better. Sell on a daily close below $104.
As it turned out the buy level in the stock and option were hit.
AAPL gapped higher (see chart) after the earnings and rallied over 20% in the next month. Of course the option did even better.
Over the weekend “Coal Mine Canaries Keep Market Rally Alive” I discussed how the perpetual bears who follow the fundamentals; like P/E ratios, sales etc are good for the market as they warn new investors not to buy stocks.
If the bearish articles disappear then I would be more concerned about the stock market but the A/D lines currently show signs of topping out.
In A Soaring Market Don’t Be Greedy - October 10, 2017

Even though the stock market continues to move higher Wall Street analysts continue to become more bullish as a JP Morgan Chase head equity strategist commented today that “ modest corporate tax reform could send stocks soaring higher, potentially adding 150 points or more to the S&P 500”.
Regular readers know that I do not place much in Wall Street strategists. In April 2016 the A/D lines had already made new highs which signaled a very bullish outlook for stocks.
Then the same JP Morgan Chase analyst was not very bullish as he thought the rally from the February 2016 lows was just short covering. That was obviously not the case as the SPY is up 27% since then.
In my weekend article “Don’t Make These Two Investing Mistakes Now” I discussed how those who have not participated in the stock market gains may finally want to get involved but often they make two common mistakes.

They either chase performance by buying too high or they buy stocks that have not yet participated in the market rally. In the article I discussed the weak relative performance of General Electric (GE) and International Business Machines (IBM) which are two of the weakest Dow stocks. This week GE has dropped another 4%.
In today's article Should Traders Take Some Bank Profits? I suggested that even though the bank stocks that report this week have not yet completed tops my risk analysis suggested that traders should consider taking at least partial profits ahead of earnings.
It of course is possible they will rally another 3% on an earnings beats but even if their earnings turn out better than expected a sharp decline is still possible.
In making the recommendations for both the Viper ETF Report and the Viper Hot Stocks Report this type of risk/reward analysis is applied to all new positions.
If this disciplined approach makes sense to you I hope you will consider either the Viper ETF Report or the Viper Hot Stocks Report.
I provide detailed market commentary twice each week along with specific buy and sell advice. Each service is only $34.95 per month and can be cancelled on line at any time.
Measuring Investment Risk Versus Reward - Oct. 5, 2017

At the market’s correction low at the start of September (see Tweet) there were very few people who were bullish on the stock market.
Many were worrying about the weak historical record of stocks in September and the volatile global environment. The positive action of the A/D lines painted a much different picture.
Stocks had a great session on Thursday as only the Dow Transports and Dow Utilities closed lower. The Dow Industrials and S&P 500 were both up 0.5% and 1803 NYSE stocks advanced with 1144 declining.
Several Wall Street analysis have raised their year-end target for the S&P 500 which is often not a good sign. A majority of the market averages are now quite overextended as they are in high risk buy areas.

In my analysis I focus more on the risk than the reward.
In the Viper Hot Stocks Report on August 23rd I recommended Netflix Inc. (NFLX) at $168.28 with a stop at $163.36 which was a risk of 3.1%.
The recommendation was based on the weekly doji buy signal and the fact that NFLX had corrected over 14% from its recent high.
At the time I noted that the upper boundary of the trading range was at $200.
NFLX closed today at $194.39 up 5.4%. The chart shows that is completed the flag formation (lines a and b) which is very positive. Half the position was sold last month for over a 10% profit.

One ETF I am currently watching is the Consumer Staples Sector Select (XLP). The weekly chart shows that XLP is close now to triggering a weekly doji buy signal.
On the risk side the low in July and in February was $53.52 so a stop needs to be placed under this level (line b). With a stop for example at $53.27 and an entry at $54.35 the riskwould be 2%.
The upper chart resistance, line a, is at $57.50 so there is a potential gain of 6% which is three times the risk.
Of course XLP could move even higher. The close over the next few days will likely determine whether it is recommended to the Viper ETF clients.
In making the recommendations for both the Viper ETF Report and the Viper Hot Stocks Report this type of risk/reward analysis is applied to all new positions.
If this disciplined approach appeals to you I hope you will consider either the Viper ETF Report or the Viper Hot Stocks Report.
I provide detailed market commentary twice each week along with specific buy and sell advice. Each service is only $34.95 per month and can be cancelled on line at any time.
Best regards
Tom
Hope Your Reading The Free Viper Report Emails - Oct. 1, 2017

The stock market looked indecisive as it started off the week which was indicated by theweekly dojis. The tax plan turned many bullish as it was a good week that finished a strong month and quarter for the stock market. The S&P 500 recorded its eight quarterly gain as it was up 4%.
In the September 10th free Viper Report email titled “Patience Required” I commented that “the daily A/D lines still indicate the market is going to head higher but it seems patience may be required to ride out the choppy market action. New long positions were established on last Tuesday’s sharp decline”.
The next week I explained why I thought that “Buying The Dip Was Right Strategy” (it was sent out on September 17th) Therefore I hope you were not too surprised about last week’s market action and the strong quarterly performance.
It was the Dow Industrials 234 point decline on Tuesday September 5th that convinced many that the market's correction was not over. Based on my analysis of theadvance/decline lines the sharp market correction was clearly a buying opportunity.

In my weekend article “How Much Higher Can The Small Caps Go?” I take a look at what historically has happened when the small cap stocks outperform the large cap stocks. Ihope you have found the free Viper Report emails helpful and this article beneficial.
I hope that the free Viper Report emails may have convinced you that you could also benefit from the specific buy and sell advice in the Viper ETF Report or the Viper Hot Stocks Report. I provide detailed market commentary twice each week along with trading lessons. New subscribers to either service get five past Trading Lessons at no additional charge.
Why Commodity Trends Are Important For Investors - Sept. 24, 2017

Many investors do not think much about commodity trends unless they get a cold call from someone who wants to sell them some coins. Still they can be important for investors as the trends in crude oil, the dollar and interest rates can be important to one’s portfolio.
In last week’s article Top Technical Tool For Commodities I explained how I use a little know indicator called the Herrick Payoff Index (HPI) to spot trends in the commodity markets, it is especially effective when the hedge funds and big managers are either very long or very short. This is frequently the case as they get
caught on the wrong side of the market.

Currently they are very short the dollar as I discussed in my weekend article “Are Rising Rates Good For Stocks”. The weekly dollar index chart shows that the HPI is close to turning positive. Also on the bottom of the chart “ is plotted the CFTC’s COT data on the short positions of the large speculators.
By looking at the chart it is clear that these traders were not very short as the dollar topped out but started to add to their short positions in May after the Dollar Index had already had a significant decline. Now they are uniformly short the dollar and long the foreign currencies.
The commodity analysis is used to target ETF positions in the sector ETFs like the SPFR S&P Oil & Gas (XOP) which Viper Traders bought near the recent lows. When the crude oil analysis is positive it can also help pick the energy stocks for Viper Hot Stocks traders.
This analysis of the commodity markets you will not find anywhere else. In fact Cramer’s Mad money was turning bearish on crude oil just as it bottomed.
Should You Worry About Rising Rates? - Sept. 21, 2017

The FOMC announcement on Wednesday added some clarity to their plans for interestrates as the probability of a rate hike in December jumped to 70%. They are also planning three rate hikes in 2018 if conditions permit.
Many investors believe the popular misconception promoted by the general media that higher rates are immediately bad for stocks.
What they miss is that there is historically a long lead-time between when rates start to rise and stocks actually top out.
On average the research from Deutsche Bank reveals that it takes 41 months from beginning of a rate-hike cycle before a recession starts.
The Dow Industrials and S&P 500 made new highs this week but with the selling Thursday they are only up slightly for the week.
Many stocks have done much better as Viper Hot Stock traders took profits in two of their holdings.

Some may remember (Why I Sold Micron Technology Before Earnings) that profits were taken in Micron Technology (MU) on June 26th before it started its decline in reaction to earnings.
New longs were established on August 21st and they were sold Monday for a 19.3% profit in just 19 days. Even though MU has since moved a bit higher this was part of the original plan.
Traders also took a profit on half of their position in Netflix (NFLX) on Wednesday at $185.78. The long positions had been established the week ending August 25th.
The recommendation was based on the weekly doji buy signal and the fact that NFLX had reached support. Longs were established at an average price of $168.28. We took a bit of heat initially as it had a low of $164.23 before it turned higher.
Even though I have upside targets for NFLX in the $198-$200 area selling 50% for a double digit profit reduced the risk on the position. This also allows us to raise the stop on the remaining position and to lock in a profit.
If you think that you might benefit from my specific buy and sell advice on stocks or ETFs hope you will consider a subscription to either the Viper ETF Report or the Viper Hot Stocks Report.
Buying The Dip Was Right Strategy - Sept. 17, 2017
The Dow Industrials 234 point decline on Tuesday September 5th convinced some that the market's correction was not yet over. Based on my analysis of the advance/decline lines the sharp market correction was clearly a buying opportunity.
By the market’s close on Friday September 8th my advice to Viper Report clients in the last email was that patience was required for those who had established long positions on the market's sharp decline.
The sharply higher open on Monday September 11th confirmed that the market’s dip was over as the Dow Industrials were up 2.16% last week while the S&P 500 gained 1.58%.

The action last week apparently finally convinced the nervous individual investors as according to AAII the bullish % surged 12% to 41.3% as the bearish % dropped 13.8% to 22%.

CNN's Fear & Greed Index closed at 78 on September 15th which was in extreme greed territory. Just a week ago this index stood at 38 which was in fear territory. This sharp turnaround does not invalidate the bullish case for the stock market.
As I pointed out last week’s free Viper Report email I use a combination of methods as well as over thirty years of experience to determine the levels where I will be buying on a dip. Some of these methods were explained in the trading lesson I sent you last week.

The buy the dip strategy was set up on August 30th, line 1, as the daily chart (on left) shows that the Nasdaq 100 A/D line moved through its downtrend, line a. This confirmed that the correction was over and that new buying was favored.
The 30 minute chart of the QQQ (on right) shows that it closed Friday at $146. Viper ETF Traders were instructed to go 50% long the QQQ at $144.38 and 50% long at $143.64 with a stop at $138.77.
The Tuesday low was $143.60 so both buy levels were hit. The market’s further pullback on September 8th held well above the lows.
If you think that you might benefits from the specific buy and sell advice like that in the QQQ as well as the longer term strategy (investors are long QQQ since early December) then I hope you will consider a subscription to either the Viper ETF Report or the Viper Hot Stocks Report.
Patience Required? - September 10, 2017

The stock market found little reason to rally late in the week as Tuesday’s sharp drop seemed to set the tone for the rest of the week. Even the debt deal did not get much of a reaction but given the poor record of Congress in such matters it was a relief.
There is little economic data until the end of the week with most reports on Friday. The level of hurricane destruction is likely to impact investor sentiment. Of course any new action by North Korea will rattle the markets.
Bullish sentiment according to AAII rose 4.3% to 29.3% which was not surprising. It is still at relatively low levels with the bearish sentiment at 35.7% down 4.2%. The CNN Fear & Greed index is back to 38 (fear) as it was 49 last week (neutral). If we get more selling this week it could drop even lower.

Since I will be traveling this week I just concentrated on my market analysis in my weekend article “The Week Ahead Markets”
The daily A/D lines still indicate the market is going to head higher but it seemspatience may be required to ride out the choppy market action. New long positions were established on last Tuesday’s sharp decline. The entry levels were well below where the markets closed before the Labor Day weekend and gave traders the opportunity to buy on weakness.
I use a combination of technical tools including chart analysis, pivot points and retracement levels to target my buy levels. I have attached a trading lesson “Profiting From Pivot Analysis” that was previously sent out as part of my Viper Premium subscription service. It explains some of the techniques that I use to target price levels and is designed to teach my clients so I hope you find it beneficial.
If you are interested in receiving specific buy and sell advice while also learning more about the markets I hope you will consider a subscription to either the Viper ETF Report or the Viper Hot Stocks Report.
Correction Over – ETFs, Stocks or Both? - Sept. 3, 2017

The stock market was able to rebound nicely from last Tuesday’s lower opening and by Wednesday’s close the Nasdaq 100 A/D line had moved out of the corrective mode. By the end of the week all of the A/D lines except the Russell 2000 had made new weekly highs.
The individual investors were even less bullish last week as the bullish % dropped to 25% while 39.9% were bearish. This is likely to change this week but it indicates there are still a number of investors on the sidelines.
Instead of a deep correction it turns out that this was just a dip in all except the small Cap Russell 2000 which at one point was down 7% from the July highs. In my weekend articleI look at past instances when the A/D line analysis helped warn you of much more serious declines.

There were a number of positive changes in our sectors last week as some of the Viper ETF favorites like health care had a great week as the Vanguard Health Care (VHT) was up 3.2%. Traders are looking for a pullback to do new buying.
In addition to technology where there are some specialty ETFs that look good we are also looking for a pullback in the materials. On the other hand I am not impressed with the financial or bank ETFs at this time.
As for stocks are Viper Hot Stock longs in Netflix (NFLX) and Micron Technology (MU) are acting well. The weekly scan turned up a number of new buy signals for me to review for Tuesday’s report.
If you are interested in learning more about the stock market while receiving in-depth market commentary and specific buy/sell advice I hope you will consider a subscription to either the Viper ETF Report or the Viper Hot Stocks Report.