

It was certainly a roller coaster week for the stock market as after dropping last Monday the S&P 500 ended over 1% higher on Tuesday. Last week I was very cautious about new buying as the ECB and jobs report in my opinion made the market more vulnerable to a correction.
Strong action in the futures early Tuesday pointed to a higher opening but subscribers to the Viper ETF Report were advised to close out their IWM call spread for a 30% profit as selling into strength is always preferred. The strong close Tuesday was followed by consecutive declines of 1% and 1.4% as traders dumped stocks after the ECB announcement. After these two down days the IWM option position had dropped 50% from Tuesday's opening.
The weak action on Thursday's encouraged some to go short heading into Friday's jobs report. The fact that the major averages were below the daily starc- bands indicated it was a high risk time to sell. The wide swings last week has probably caused further confusion amongst investors as to which way the market is heading.
Many are wondering after a reviewing their 2015 performance if they should be buying or selling stocks as the approach the New Year. Aggressive buying was the correct strategy in December 2012 when the new high in the NSYE A/D line on the 12th made me quite bullish as I wrote in "Stuff Those Stockings with Stocks". At the time the fear over the "fiscal cliff" had kept many out of stocks
The Spyder Trust (SPY) gained 32.3% in 2013 as it was the best year in the last ten. Will 2016 be like 2013?
As I discuss in more detail in the Market Wrap section the technical outlook is positive but is not yet as strong as it was in 2012. The massive gains Friday favors buying on weakness now but in October there were several better opportunities (Should You Be Buying The Dip?) where the risk could be well controlled as the market was oversold.
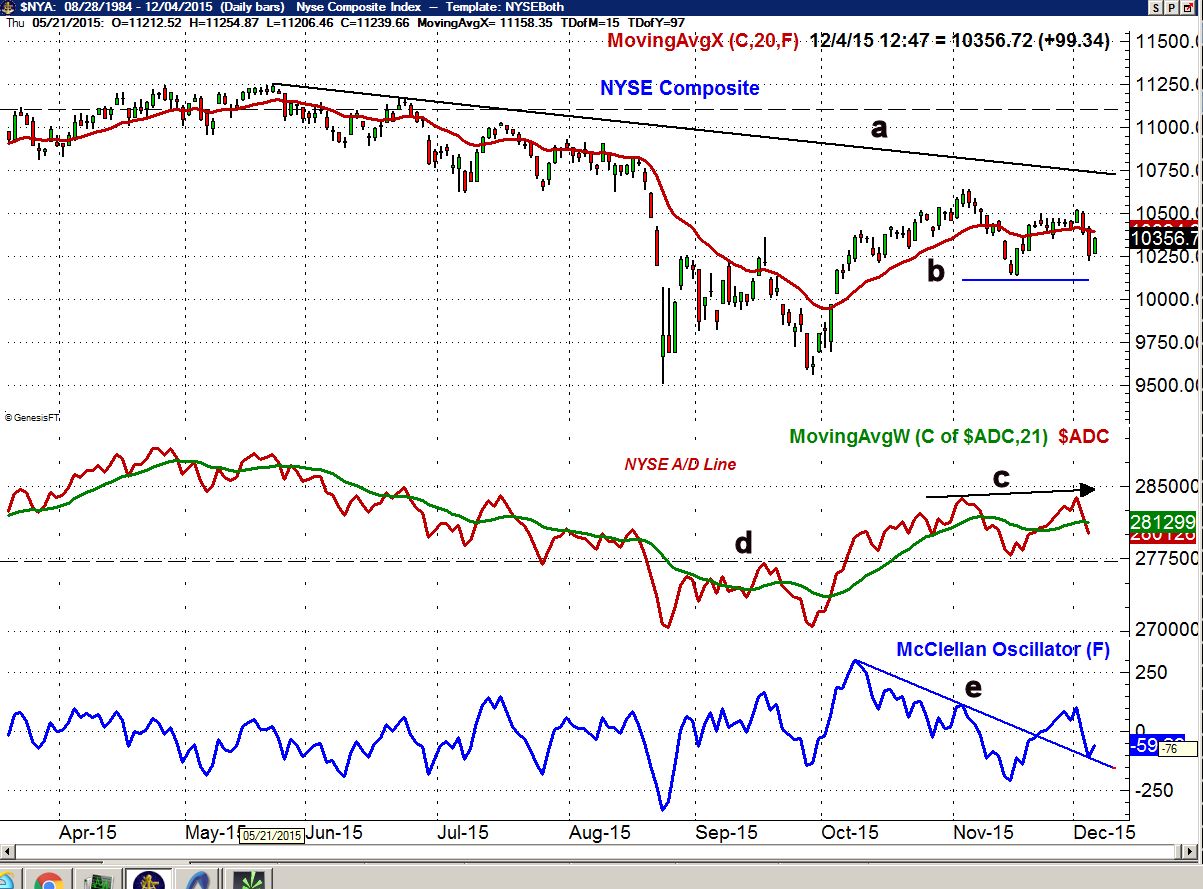
The daily chart of the NYSE Composite shows that it is still in a range since the early November high. The downtrend, line a, is in the 10,700 area with more important resistance above 11,000.
The action at the October low was consistent with a sustainable market rally but the sharp pullback from the early November high as put many on the sidelines. The market internals last week started acting stronger than prices as the NYSE A/D line was able to move above the November high, line c, even though prices did not.
The A/D line is close to moving back above its WMA once Friday's final numbers were added. A breakout above last Monday's high would be very positive for the market as we head into January. It would take a drop below the key A/D line support at line d, to weaken the outlook.
The McClellan oscillator has dropped down to retest the breakout level, line e, and a rally back above the zero line will be a sign of positive short term momentum. There is short term support now at 10,220 with the quarterly pivot at 10,113 (line b)
The sentiment for stocks has turned more cautious for stocks which is a plus as the bullish % dropped last week to 29.5% with 21.2% bearish. The neutral % is quite high at 49.3% as it rose 7.7% last week. This is a positive favor for the stocks market and the CNN Fear & Greed Index is now neutral but just a month ago it was in Greed territory.
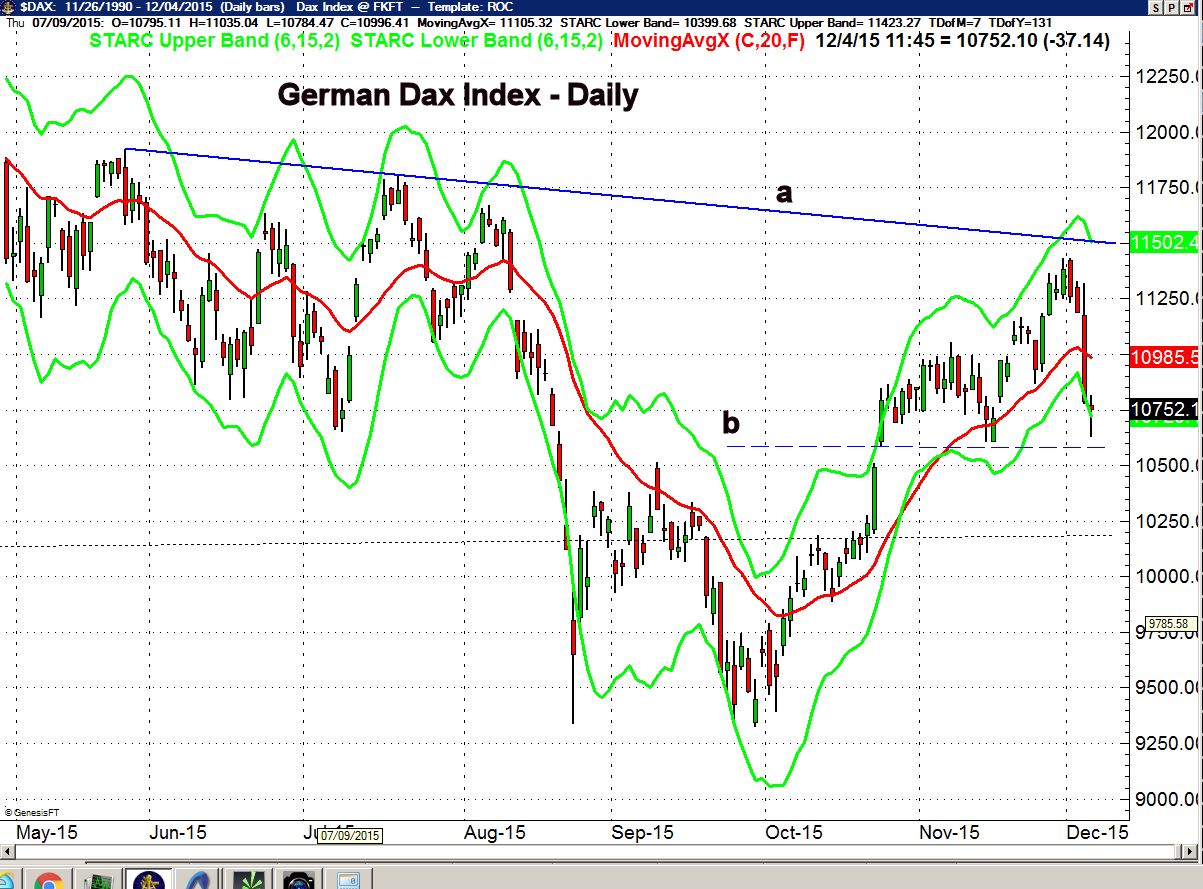
Of course the market is assuming that the FOMC will decide to raise rates at their December 15th-16th meeting. It will also be important that the Euro zone markets do not drop much further. The German Dax dropped almost 7% from Monday's high to Friday's low and has next important support in 10,600 area. It dropped well below the daily starc- band on Friday indicating it was in a high risk sell zone. It now needs to close back above 11,000.

Though the SPY is only up 1.5% so far in 2015 the Consumer Discretionary Sector Select (XLY) is up 11.6%. The weekly chart shows that since June 12th (line 1) the weekly relative performance and OBV analysis on XLY have been positive as it has gained 6.8%.
Other sectors have also beat the SPY as the SPDR S&P Biotech ETF is up 11.3% YTD. The PowerShares QQQ Trust (QQQ) has also done well as it is up 9.2% while the Technology Sector Selects has also outperformed the SPY as it is up 6.6%. I think that some of the best profit opportunities in the 1st quarter of 2016 will be in some of these specialty ETFs.
The Economy
There was more disappointing news for the manufacturing sector last week as the Dallas Fed contracted for the 11th consecutive month and the Chicago PMI dropped into contraction territory at 48.9. The ISM Manufacturing Index also dropped below 50 as it came in at 48.9.
The ISM Non-manufacturing Index was also down last month to 55.9 which was lower than the consensus estimate as it dropped from the October reading at 59.1. The longer term trend remains positive.
The Pending Home Sales were up a meager 0.2% while Construction Spending was up 1.0% as it has been positive for most of the year.
The calendar this week is light with Import and Export Prices on Thursday followed by the PPI. Retail Sales and Consumer Sentiment on Friday.
Interest Rates & Commodities
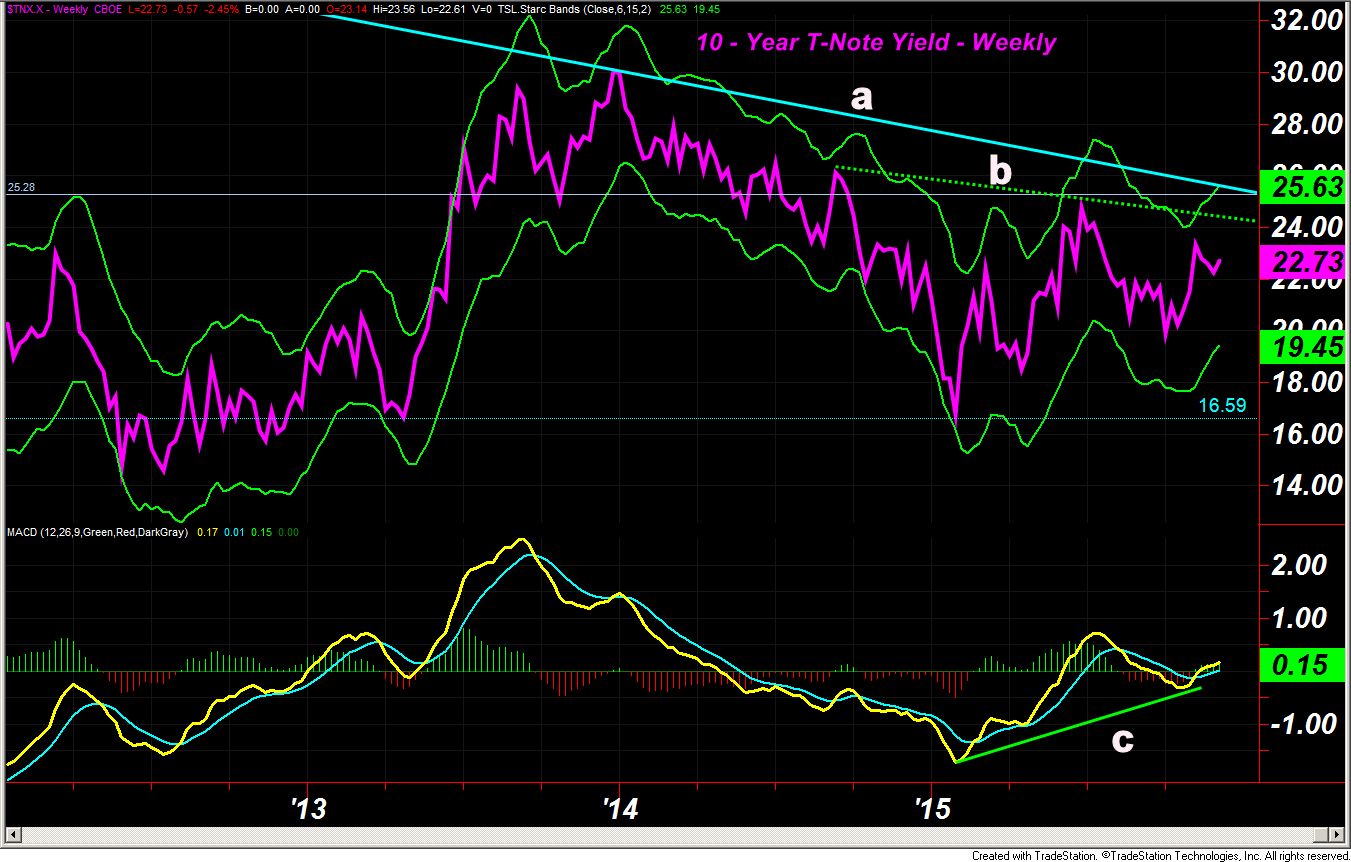
The yield on the 10 Year T-Note edged slightly higher and a weekly close back above 2.35% will make a break of the short term downtrend, line b, quite likely. The longer term downtrend, line a, and the weekly starc+ band are in the 2.56% area. As I noted a few weeks ago the weekly MACD analysis, line c, did favor higher yields.
The lack of any substantial policy change from OPEC has put further pressure on crude oil prices which dipped below the $40 level last week. The energy stocks are still holding up better as the SPDR S&P Oil & Gas Exploration (XOP) is still holding above the early October lows.
Gold was a bright spot this week as the gold futures closed up 2.6% The technical outlook had been negative for gold since mid- October when I commented that "the current rally will likely ultimately fail". Gold had quite a sharp drop but unfortunately I was not aggressive enough on the short side. A further rally is gold is likely but the current technical outlook looks more interesting on the gold miners.
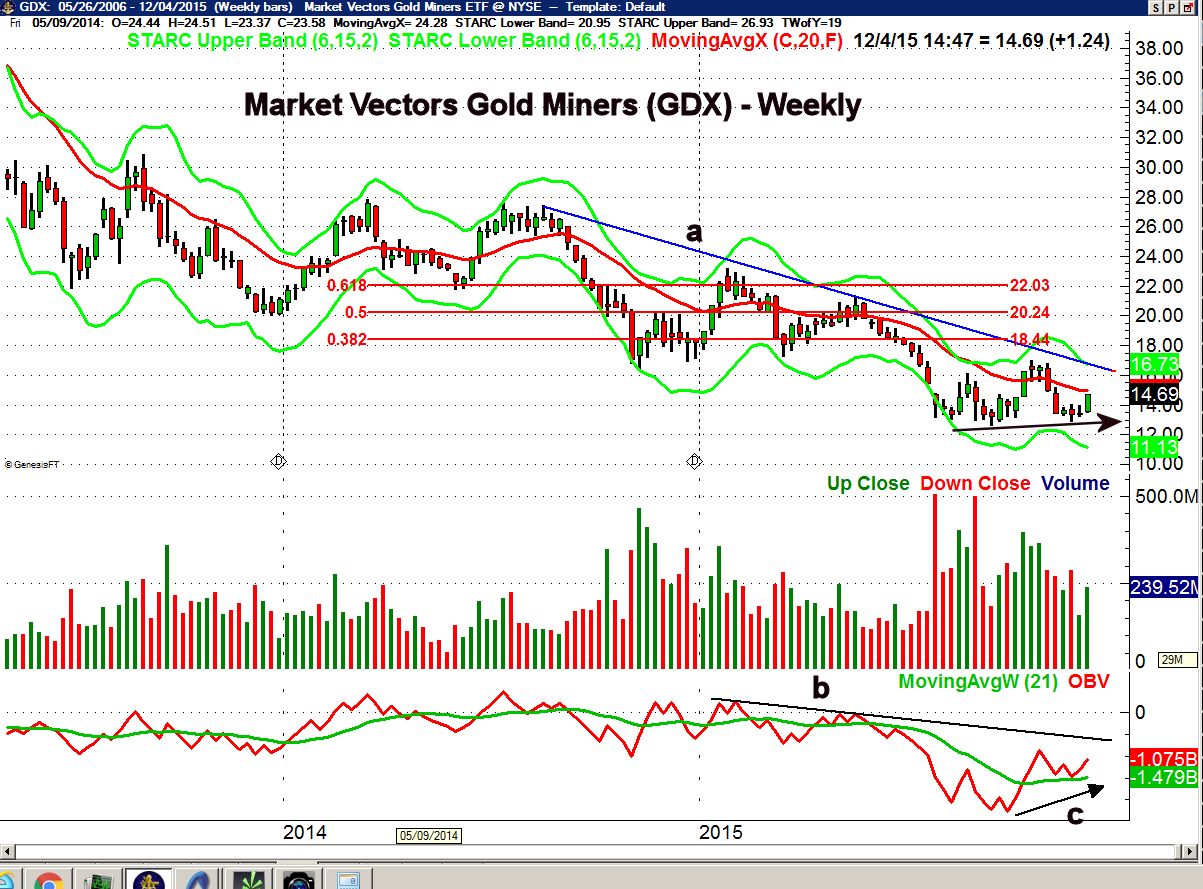
The weekly chart of the Market Vectors Gold Miners (GDX) shows a potential double bottom formation. It closed just below the 20 week EMA at $15 with the October high and downtrend (line a) in the $17 area. The 38.2% Fibonacci retracement resistance from the early 2014 high is at $18.44 with the 50% resistance at $20.44.
At the low of $12.92 three weeks ago the weekly OBV held above its flat WMA as the OBV was much higher than it was in early September when it made a low of $12.62. The current OBV pattern looks bullish with key resistance now at the downtrend, line b. The daily OBV (not shown) is also positive and I will be looking to buy GDX or establish a vertical call spread next week.
Market Wrap
Even though the major averages posted gains of over 2% on Friday, the Dow Industrials rose just 0.28% while the S&P 500 was up even less. The Dow Transport were down 3.17% while the small cap Russell 2000 lost 1.58%.
Technology stocks led the way last week gaining 1.5% followed by over a 1% gain in the telecommunication stocks. The financial, material and consumer services stocks posted gains of around 0.40% while oil & gas stocks dropped again losing 4.6%. The defensive health care and utilities were also lower.
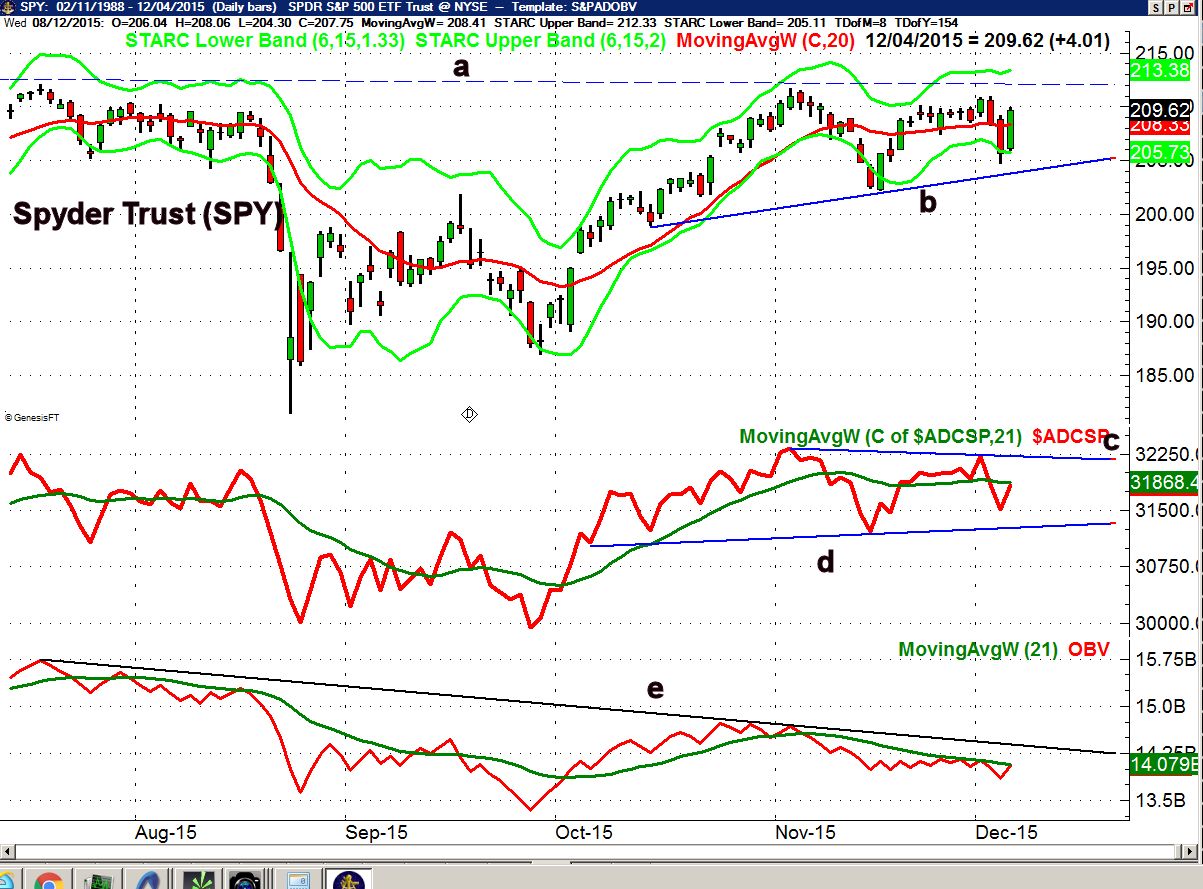
The daily chart of the Spyder Trust (SPY) shows the drop below the daily starc- band last Thursday before Friday's 2% gain. A strong close above the resistance at line a, will have initial upside targets in the $217-$220 area. The 20 day EMA is at $208.33 with the monthly pivot at $207.51. There is more important chart support now at $202.
The S&P 500 A/D line, unlike the NYSE, did not make a new high on December 1st. The key resistance at line c, needs to be overcome to signal an upside breakout. Conversely a drop below support at line d, would be negative. Still mixed signals from the OBV as while the daily OBV is in a downtrend, the weekly (not shown) has made new highs. As always the weekly is more important.
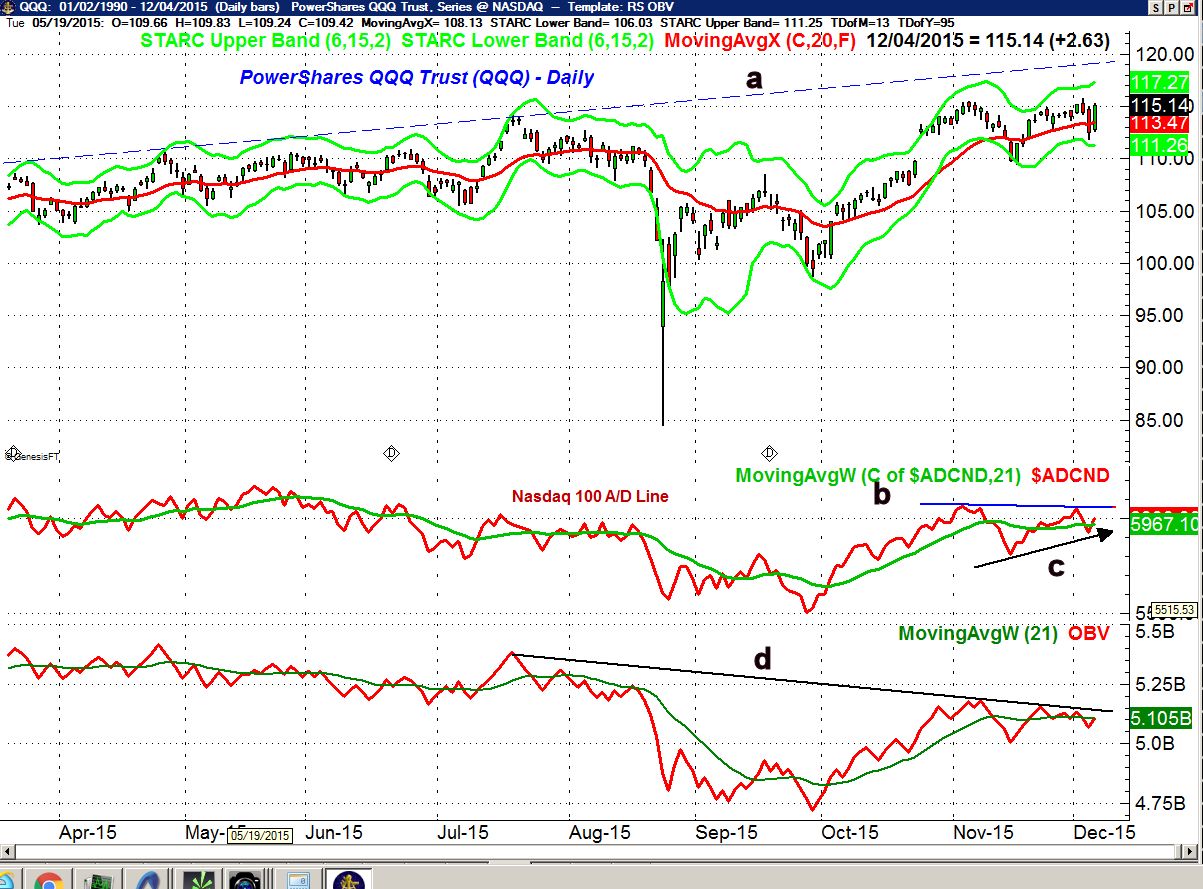
The PowerShares QQQ Trust (QQQ) has been a market leader throughout 2015 and there are no signs that this is going to change. The daily chart resistance, line a, is in the $119 area with the weekly starc+ band at $123.67.
The Nasdaq 100 reversed back above its WMA on Friday and is not far now below the key resistance at line b. The higher lows in the A/D line (see arrow) are positive. The daily OBV is very close to moving back above its WMA while the weekly continues to look strong. The 20 day EMA is at $113.47 with the weekly at $110.12.
I continue to think the small cap iShares Russell 2000 (IWM) will surprise many by early January. It dropped down to test the $116 area on Thursday. The Russell A/D line (not shown) reversed back to the upside on Friday and is back above its WMA . Still key resistance in the $119.50-$120 area and last week's high.
What to do?
Many investors remain very skeptical about the health of the economy as they tend to focus on the continued weakness in the manufacturing sector not on the further improvement in the job market.
Since last summer I have thought that the positive impact of lower crude oil prices was more important than the economic pressure on the energy patch. The strong action of the Leading Economic Indicators (LEI) discussed a few weeks ago (see chart) is consistent with further strengthening of the economy.
Given the current technical outlook I think that the odds favor an upside breakout in the A/D lines and therefore the market averages. This would be a very positive sign for stock investors in the 1st quarter of 2016 and is consistent with continued improvement in the economy.
Therefore those who are not in stocks should seriously consider a dollar cost averaging strategy on weakness in a low cost ETF that focuses either on the S&P 500 or the global markets. One I have favored previously is the Vanguard Total Stock Market ETF (VTI) which is also part of my retirement portfolio.
More aggressive investors who are already invested should consider strategic positions in small caps as well as some of the sector targeted ETFs. One needs to pay close attention to the entry point as well as to the risk until a stronger trend emerges.
So what could spoil the positive outlook? If the S&P 500 were to close below the mid-November lows it would seriously weaken the intermediate term outlook.
Editor's note: If you like Tom's analysis and want specific entry/exit advice on ETFs check out Viper ETF Report his premium newsletter.
Comments
comments