
Editor’s note: If you like Tom’s analysis and want specific entry/exit advice on ETFs check out Viper ETF Report his premium newsletter.
As we approach year-end many are already starting to make portfolio plans for the year ahead. For those who have the option some are still trying to decide whether they should be investing for retirement in ETFs or mutual funds.
Of course cost is one concern as generally mutual funds have a higher cost that ETFs though this should be examined case by case. In a very strong trend higher expenses do not mean you cannot make money. During 2009-2010 my 401K was invested in Fidelity Select Precious Metals (FSAGX) which has expense ratio of 0.90%.
FSAGX was up 38% in 2009 and 35.2% in 2010 so the fact that its expense ratio was higher than the expense ratio of 0.46% which is charged by the Market Vectors Gold Miners (GDX) did not have much of an impact.
If you are paying commissions to buy and sell ETFs then this also has to be figured into your costs. Index funds and those that are actively managed often have much different expense ratios. The Spyder Trust (SPY) has an net expense ratio of 0.11% while it is 0.64% for the Fidelity Contrafund (FCNTX). Some are even higher as the JPMorgan Growth Advantage Fund (VHIAX) has a net expense ratio of 1.25%.
So far in 2015, according to Morningstar VHIAX is up 9.7% versus just 2.8% for SPY and 8.4% for FCNTX. In my recommendations for ETFs I use a combination of relative performance and quarterly pivot point analysis. As I discussed in "Learn To Drive Your Own 401k" the relative performance can be a very useful tool in timing entries and exits in your mutual funds.
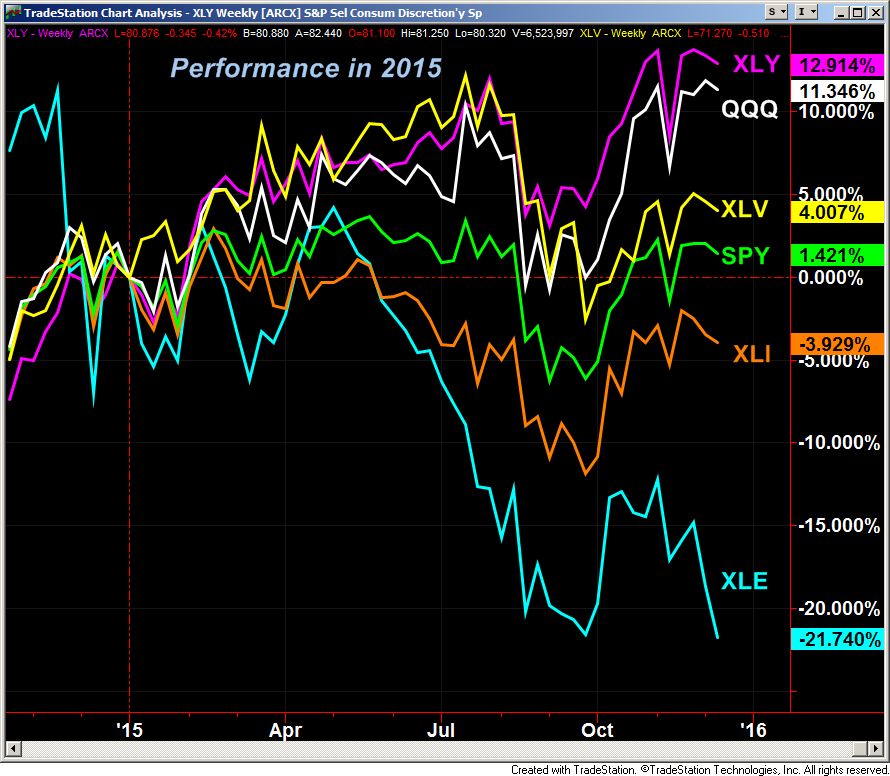
Truly it has been a tough year for the stock market as only those who concentrated on just a few market sectors or stocks have done well. The consumer discretionary (XLY) and technology stocks like those in the PowerShares QQQ Trust (QQQ) are showing double digit gains for the year while the SPY is up just 1.4%.
Even though the Industrials Sector Select (XLI) did have a nice rally from the late September lows it is still down almost 4% YTD. The Energy Sector Select (XLE) rallied almost 15% from its September 25th low but with the heavy selling in the past week it is now down over 23% in 2015.
Since 2009 XLE has managed to gain over 20% in three years, 2009, 2010 and 2013. The 39% drop in 2008 was the worst performance in the past ten years but I would not be surprised if 2016 was a better year for energy stocks.

Since volume analysis also plays an important role in my analysis I favor ETFs since volume is not available in mutual funds. My regular weekly review of some leading ETFs shows that all except the XLE closed last week above their quarterly pivot levels The Powershares QQQ Trust (QQQ) has not had a weekly close below its quarterly pivot so far this quarter.
As the table indicates both the monthly as well as the weekly relative performance and on-balance-volume analysis are both positive for QQQ. This is also true for the SPDR Dow Industrials (DIA), Spyder Trust (SPY) , Technology Sector Select (XLK) and Financial Sector Select (XLF).
One of my favorite ETFs for the past six months has been the Consumer Discretionary Sector Select (XLY) even though the monthly OBV has been below its WMA for the past two months. The weekly analysis has been solidly positive since last June (see chart).
So how to get started?
The weekly studies I have found to be the best time frame for most investors to follow when looking to allocate funds between sectors. The monthly analysis is also important for staying with a trend and also for identifying ETFs that you should be watching.
For example, the monthly OBV on the Health Care Sector Select (XLV) was positive from the start of 2012 until the September 2015 close. It gained 114% during this period and the monthly OBV for XLV could turn back to positive this month.
Many brokerage firms and mutual fund families allow commission free trading of their ETFs and select mutual funds. The average investor should consider a 50-60% allocation to equities until there are signs of a bear market. Of this 20-30% should be in an index fund like the Spyder Trust (SPY) or the Vanguard Total Stock Market (VTI) in which I have a position.
For the initial entry look for a day when the stock market is down sharply. For the remainder look to establish a 5-8% in those market leading ETFs but if you are investing or trading commission free then scaling into a positions is the best strategy.
Currently technology, consumer discretionary and financials are my favorites but I do expect health care/biotech to return to the forefront in 2016.
Comments
comments