With the recent gains some are already talking about a bottom for BitcoinBTC. There is always chance, but I prefer to draw my conclusions after looking at the price behavior. At the end of April 2022, I was sent an article with a headline about Bitcoin moving to $100,000. I have often seen similar, what I would call ludicrous posts, in the past. My immediate reaction is to hope that no new investors will act based on such a view and then secondly to look at the charts.
As was the case in 2018, when I reacted to similar commentary, the charts in April were quite negative. It was my conclusion that if Bitcoin, which was currently trading at 38,407, were to drop below a key price level (Key Bitcoin Levels To Watch) then prices were likely to go significantly lower.

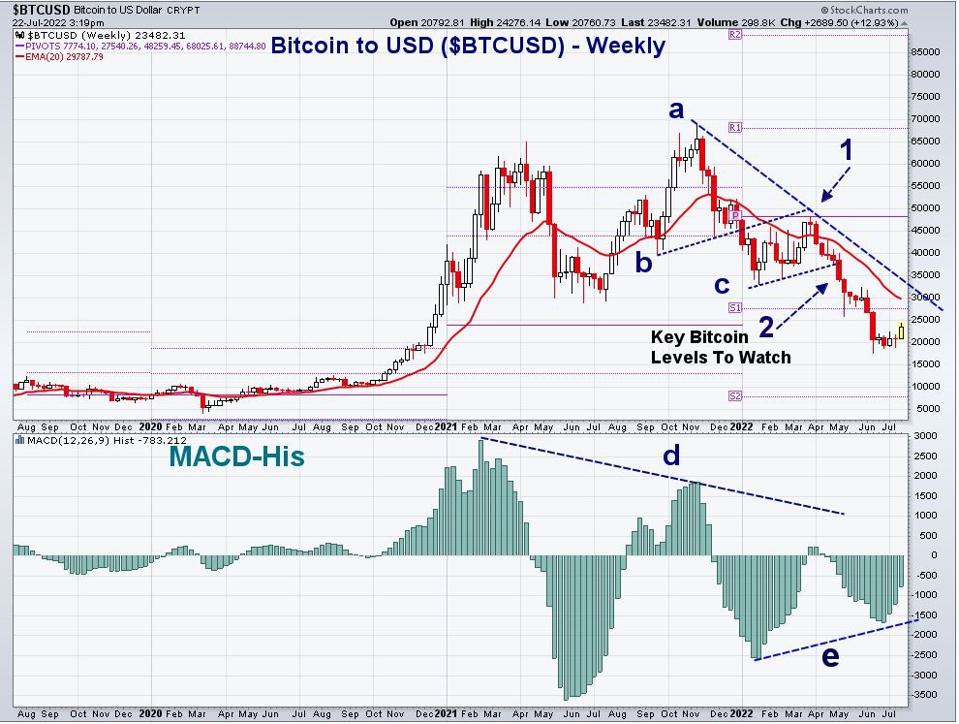
The analysis was based in part on this now updated weekly chart of the BitcoinUSD price. After the rebound to the yearly pivot at $48.259 failed in March, point 1, the technical evidence made me confident that the rebound, lines b and c, was just a pause in the decline. The drop below support at point 2, completed the formation as the initial target was the yearly pivot support S1 at $27,540. By June the low was $17,600.
Even with the 13% rebound so far this week there is plenty of resistance above the market. The S1 is now an area to watch and the declining 20 week EMA at $29,798 should provide strong resistance to a further rally. The weekly downtrend, line a, is currently in the $32,500 area.
The weekly MACD-His had turned negative before the May decline and while it is rising it is still well below the zero line. The MACD-His has formed higher lows, line e, which is potentially a positive sign. It will take time and a much stronger rally to suggest that a weekly bottom has indeed formed.

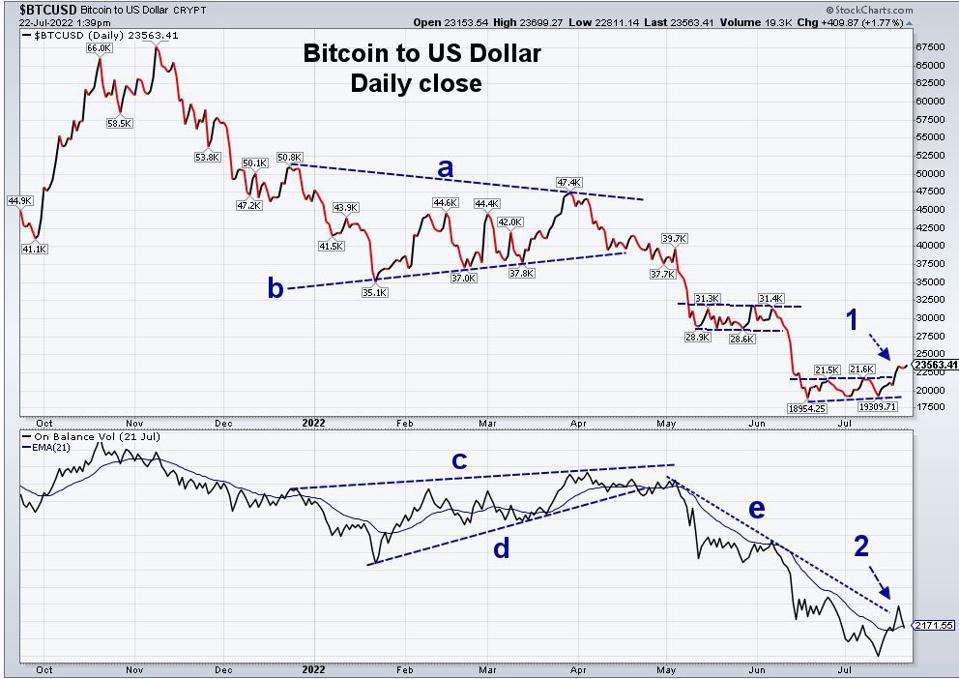
The daily chart more clearly shows the continuation pattern, lines a and b between the January low and the late March high. By measuring the width of the formation, a downside target in the $20,000 area could be projected after support at line b was violated.
As is often the case, the on-balance-volume (OBV) shows a similar pattern, lines c and d. It dropped sharply in early May confirming the price action. When prices developed a trading range in May and early June so did the OBV as this was another pause in Bitcoin’s decline.
The recent trading range was completed this week as the resistance in the $21,600 area, point 1, was overcome. This is a short-term positive that does favor further gains. A close below 19,300 will mean another wave of selling. The OBV has broken its steep downtrend, line e, and moved above its EMA, point 2, which is a positive sign. A move in the OBV above the recent high could signal a potential move to the $26,500-$27,500 area.
After such a sharp price decline and the well-publicized disruption in the market’s liquidity, it is too early to conclude that a major bottom is in place. The extent of the price decline and the recent rally is likely to generate some more wildly bullish comments. In my view those who are still long should consider selling on a rally back to the $26,500-$27,500.
Comments
comments