

Before the release of Apple’s earnings I was nervous that the expectations were too high especially with the increased market volatility. The Dow Industrials ability to overcome the 22,000 level was due primarily to the strength of four stocks; Boeing (BA), Apple (AAPL), McDonald’s (MCD) and Caterpillar CAT).
It is a concern that the Dow Industrials, the least diversified of the most popular market averages, is leading the market higher. The gains have not yet been confirmed by the other major averages. In fact the Dow Transports at last week’s low was down 6.7% from its recent high.
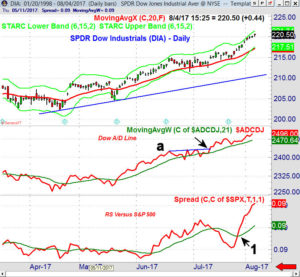

The daily chart of the Dow Industrials shows that the Dow A/D line broke through resistance, line a, on July 12th as did most of the other major A/D lines. It has continued to make a series of higher highs but has been much stronger than the other A/D lines in the past week.
There is quarterly pivot resistance for DIA at $222.08 with the weekly starc+ band at $221.90. The relative performance moved back above its WMA (point 1) in late July signaling it was leading the S&P 500 higher.
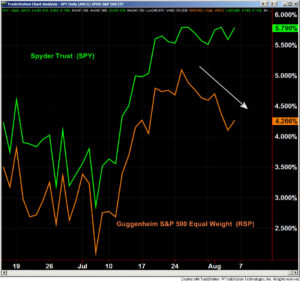

Other methods are also highlighting the narrow action of the recent rally. The S&P 500 is a market weighted average where the performance is tied to the capitalization or the value of the companies. In contrast to the Spyder Trust (SPY) the Guggenheim S&P 500 Equal Weight ETF (RSP) gives an equal weight to all the stocks in the S&P 500. Both ETFs moved higher together until July 29th when RSP turned lower and the Spyder Trust (SPY) held firm. This trend continued last week.
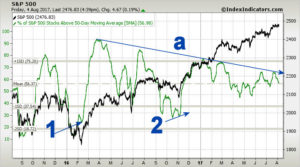

In the past I have commented on the analysis of the % of stocks above the 50 day MA for the major averages. They are often used with other technical studies to confirm market bottoms. At the February 2016 low (The Week Ahead: Is There Blood In The Streets Yet?) it was one of the signs, along the more important A/D indicators, that suggested the market was bottoming.
When the 5 day MA of the % of S&P 500 stocks above their 50 day MA drops to one standard deviation below the mean and diverges from prices (point 1) it can be a sign that the market is sold out. There was a similar signal last fall, point 2, as the stock market was ready to turn higher. On the latest rally the 5 day MA has not been able to move to overbought territory as it has stalled below the resistance at line a. This is another sign that the S&P 500 advance has narrowed.
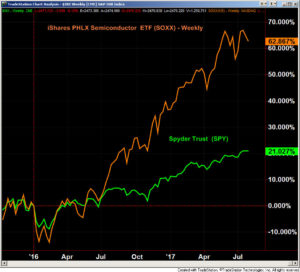

Since the 2016 low one of the strongest stock market groups has been the semiconductors. As this chart indicates that the iShares PHLX Semiconductor ETF (SOXX) has outperformed the Spyder Trust (SPY by over 40%. In last week’s article “Are The Semiconductor Stocks Topping?” I took a technical look at this key industry group.
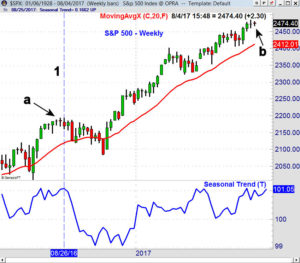

In my recent review of August stock market corrections there were some common A/D line patterns which are currently not evident. The seasonal chart of the S&P 500 going back to the 1920s indicates that it typically tops out at the end of August and early September (line 1).
It is critical that the technical indicators be used as a trigger for the seasonal trends as there are many traders who have blown up their accounts when they followed seasonal trends without technical confirmation.
On the chart you will notice that for the second week in a row the S&P 500 formed a doji (point b). This is a sign of indecision as the S&P 500 gained just 0.2% last week while the Dow Industrials was up 1.2%. A weekly close below 2459.33 will trigger a weekly sell signal. Last August the S&P 500 also formed two dojis, point 2, and the selling picked up two weeks later.
In the past I have often questioned those in the financial community who have used fundamental arguments over the past few years that the market was topping out. Thy use any number of metrics to argue their case for an overvalued market. They will be right at some point but many have been using the same argument for years.
Therefore I was very pleased last week when I heard well known analyst/journalist Henry Blodget comment on CNBC that “Valuation is worthless as a timing tool”. To many this may not seem that surprising but there have been very few fundamental analysts that would be so honest. I think we can add in several other fundamental indicators that have been used to warn of a market collapse since 2013.
Just the next day I read a column where the author’s warning to be defensive was based on the comments by Oaktree Capital Management’s Howard Marks. He is a billionaire hedge fund principal that is famous for his Oaktree memos.
In his latest he comments that “In the vast majority of asset classes, prospective returns are just about the lowest they’ve ever been”. You can find his very extensive memos going back to 1990 at the above link. He also made a very honest comment about his previous cautionary notes that started in May 2011. He said “in fact, when you’re early by six or more years, it’s not clear you can ever be described as having been right”.
Clearly if the market does have a correction in the next few months it is likely to be a pause in the major trend not the start of a new bear market. It would typically take at least 2-3 months before the A/D lines could send a serious warning and there are no signs of a recession on the horizon.
The Economy
The week started off with the Chicago PMI coming in at 58.9 which was below the consensus estimate of 61. It has been strong for the past five months and hit a three year high in June. Pending Home Sales rose 1.5% for the first gain in three months.
On Tuesday the ISM Manufacturing was slightly better than expected at 56.3 but was positive as new orders were strong. There was as similar reading from the PMI Manufacturing Index while Construction Spending was a bit weaker.
The service index data was positive but the ISM Non-Manufacturing Index was a bit lower than expected while the PMI Services Index was a bit better. The strong jobs report surprised most economists on Friday and it gave investors no reason to sell.
The economic calendar is light this week with the PPI on Thursday and the CPI on Friday. Several Fed governors are also scheduled to speak.
Interest Rates & Commodities
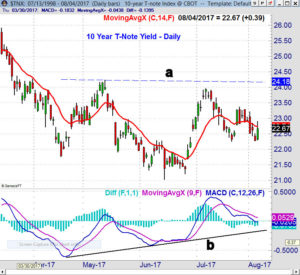

The yield on the 10 Year T-Note rose on Friday in reaction to the stronger than expected monthly jobs report. Yields were still a bit lower for the week but the daily chart shows a potential bottom formation as yields have dropped back to good retracement and pivot support. There is short term resistance at 2.337% with more important at 2.418%, line a. Though the daily MACD has been diverging from prices, line b, it is still negative.
The September crude oil contract was a bit lower last week but closed above the lows. As I mentioned last week “The Herrick Payoff Index (HPI) has moved strongly through its downtrend, line c, and is well above its WMA. Viper ETF investors and traders went long energy ETFs two weeks ago even though a weekly bottom had not been confirmed.”
The HPI measures money flow based on price, volume and open interest. The weekly HPI moved strongly above the zero line last week for the first time since last fall. Therefore the money flow is now positive.
The gold futures closed lower last week and the technical action does not look impressive. The gold and gold mining ETFs that I monitor closed Friday below their quarterly pivots. They had flipped to positive last week so this reversal may be important. As I mentioned in a previous article “Investors Should Follow The Quarterly Trend” the QPivots can be a simple but effective trend indicator.
Market Wrap
The Dow’s move above 22,000 will likely get most of the attention in the local press but it was one of the few bright spots. The strategist’s comments last week about a “bullet proof” market may be a common opinion of many average investors. The Dow’s gain of 1.2% last week may have reinforced this view.
The Dow Utilities were up 1.1% last week while the Transports rose 0.6% but the other major averages were lower. The small cap averages took the biggest hit with the Russell 2000 down 1.2%. The S&P 500 was just barely higher and the Nasdaq 100 was 0.1% lower. On the NYSE there were 1522 advancing stocks and 1546 declining. There was also a 1.3% gain in the financial stocks.
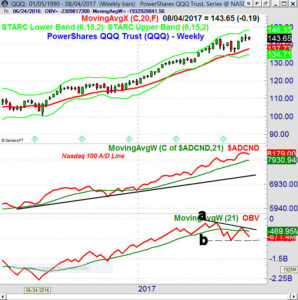

The weekly range of the Powershares QQQ Trust (QQQ) narrowed last week but it closed above the prior week’s doji low of $142.30. The quarterly pivot is at $139.26 with the rising 20 week EMA at $137.73. The weekly starc+ band is at $148.33 with the starc- band at $134.71.
The weekly Nasdaq 100 A/D has declined slightly over the past two weeks but is well above its rising WMA. The daily A/D line (not shown) is slightly below its barely rising WMA but has not started a new downtrend.
The weekly OBV declined last week after forming a negative divergence (line a) at the July 21st high. It is still above the key support at line b and a drop below this level will confirm the divergence.
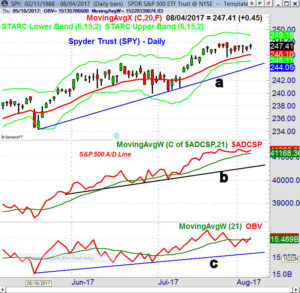

The Spyder Trust (SPY) was slightly higher Friday and volume did increase. The daily chart suggests that it may be ready to breakout of its recent trading range. The daily starc+ band is at $249.16 with the weekly at $251.59.
The daily S&P 500 A/D line made a marginal new high on Tuesday and has turned up from its WMA. This improvement could be reversed with a sharply lower close. The OBV has moved above its WMA which is an encouraging sign. The 20 day EMA is at $246.10 with stronger support at $244.60.
The iShares Russell 2000 (IWM) triggered a weekly doji sell signal last week and the daily Russell 2000 A/D line is now in a short term downtrend. The weekly A/D line is still above its WMA. The 20 day EMA is at $141.34 with the daily starc+ band at $143.39. The weekly relative performance has dropped below its WMA suggesting it is not a market leader.
What to do? The stock market was just one sharp down day away from moving into the corrective mode last week. The narrow nature of the advance cannot be ignored and I continue to be cautious about the stock market unless the market internals can get considerably stronger.
Therefore it is not a time to be aggressive on the long side of the market as Viper ETF traders are continuing to take profits on strength. There are a few special situation ETFs that look attractive from the long side for traders and our positions in the non-US ETFS are doing well.
If there is a correction it is not likely to change the major trend as a 3-4 week decline seems the most likely. If this is correct we should see more sector rotation and for investors I think the next good buying opportunity will be after a correction.
Viper Hot Stock traders have done pretty well in navigating our long positions around the earnings reports. We have taken some good profits on strength but have also been stopped out when bottom formations were aborted. We did establish a few short positions in tech stocks last week and will continue to reduce the exposure on the long side in case the market moves into the corrective mode.
I hope you will consider a subscription to either the Viper ETF Report or the Viper Hot Stocks Report where I comment twice each week on the A/D lines as well as the market in general. In addition to my specific buy and sell advice you can also learn about the markets.
Each service is only $34.95 per month and can be cancelled on line at any time.
If you are interested in learning about trading strategies you may want to download a copy of my eBook. This will also add you to the email list for the free Viper Reports. I send out market commentary and technical tips several time a week. Additional market comments are also often posted on the Viper Report Facebook page.
Comments
comments