

For the past several weeks I have been highlighting reviewing the signs that the stock market rally was weakening after the sharp rally from the July lows. By the end of July ('The Market Appears Bulletproof?') the top in the Dow Transports had been confirmed which warned of weakness in the other market averages.
The next week the Dow Industrials were leading the market higher which was a sign that fewer and fewer stocks were moving prices higher. Within the Dow Industrials thirty stocks only a few of them were pushing the Dow to new highs.
At the same time the broadly based Russell 2000, which is made up of 2000 small cap stocks, “triggered a weekly doji sell signal…. and the daily Russell 2000 A/D line is now in a short term downtrend”. This warning preceded the sharp market decline on August 10th as the S&P 500, NYSE and Nasdaq 100 A/D lines all moved into to the corrective mode.
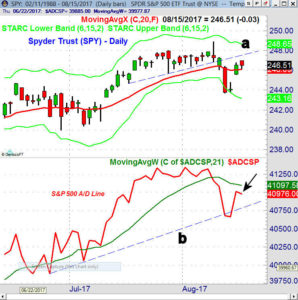

Last week I was looking a sharp market rebound based on my A/D analysis but by Tuesday’s close the charts favored a failing rally. The S&P 500 A/D line had broken support, line b, the previous week and despite Monday’s gains was still well below its declining WMA. Therefore investors and traders exited some lagging long ETF positions while Viper ETF traders bought triple inverse ETFs on Wednesday’s open.
Of course the major question is when will the correction be over and how low will it go? I have frequently discussed continuation patterns or pauses in the major trend. They occur in up and down markets and there are some classic patterns like what occurred in the PowerShares QQQ Trust (QQQ) that occurred from early June through early July (A Classic Trading Pattern In QQQ).
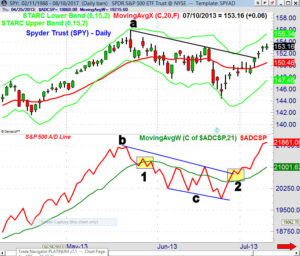

In general very few corrections are alike. In 2013 the S&P 500 A/D was strong as it has been in 2017 as it has made a series of higher highs. The daily S&P 500 A/D line made a new high on May 21st and seven days later it entered the corrective mode (point 1). The A/D plunged over the next four days and made a sharply lower low confirming the downtrend. At that point the SPY was down 5.2% from its high.
At that point the SPY edged higher for the next six days as it reached the 61.8% retracement resistance from the high but did not close above it. The A/D line did move above its declining WMA on the rebound after forming lower lows but was still in an overall downtrend.
The sharp reversal on June 19th reinforced the downtrend as SPY dropped sharply for four days as it moved below the daily starc- band. From the high to low the decline was 7.4% which did alter the previously high bullish sentiment. The resistance in the A/D, line b, was overcome on June 27 as the A/D line moved out of the corrective mode (point 2). The downtrend in the SPY, line a, was broken four days later.
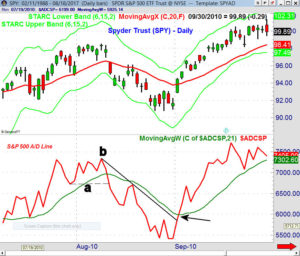
The Spyder Trust (SPY) in 2010 made its high on August 9th and two days later it gapped lower and closed weak. The S&P 500 A/D line dropped below its WMA and the previous low, line a. The decline continued for three more days as the daily starc- band was tested. The two day bounce is similar to what we saw last week as the SPY reached its declining 20 day EMA but the A/D fell short of its WMA.
The SPY declined for the next five days before prices started to bottom. This was a decline of 7.7% in just twelve days. After prices consolidated for five days the SPY opened strong on the first day September and broke its downtrend, line b. Just four days later the NYSE A/D line made a new high as I pointed out in this chart on September 8th.

All the major averages closed lower last week except the Dow Utilities which was up 1.1% as Viper ETF Investors are still 100% long XLU from the $49 area. The Russell 200 was down 1.2% followed by 0.80% drop in the Dow Industrials. The S&P 500 and Nasdaq Composite were both down 0.65% but the weekly A/D numbers were not too bad with 1386 advancing stocks and 1676 declining.
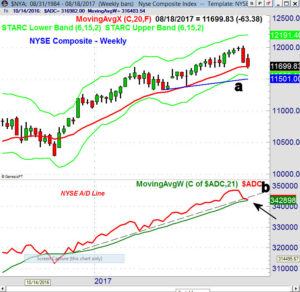
The selling has been fairly heavy in the broadly based NYSE Composite as it closed just above the quarterly pivot at 11,641 20 and the week EMA. There is next major support, line a, at 11,500. There is quarterly pivot support at 11,445. The weekly NYSE A/D line closed just above its WMA but below the support at line b. The daily A/D line did make marginal new low Friday and a doji was formed.
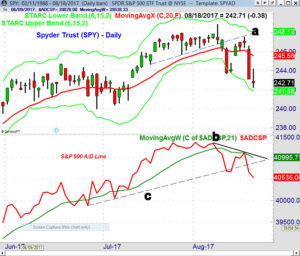
The daily chart shows that the Spyder Trust (SPY) closed just above the daily starc- band and above the monthly pivot support at $242.07. The rising 20 week EMA is at $240.62. There is minor resistance at $244 with the declining 20 day EMA at $245.58. The rally last week failed at the former uptrend, line a.
The rally in the daily S&P 500 A/D line failed at its declining WMA last week and it closed at new correction lows on Friday. The uptrend, line c, was violated a week ago. A move above the downtrend, line b, and last week’s high is needed to turn the daily A/D line positive.

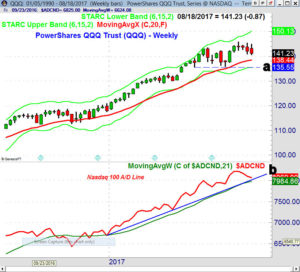
The weekly chart of the PowerShares QQQ Trust (QQQ) does not reflect any heavy selling yet as the weekly ranges have not expanded. A daily doji sell signal was generated on Thursday with a weekly doji sell the previous week.
The daily starc- band is at $139.73 with the 20 week EMA at $138.44. There is monthly pivot support at $137.37 with more important support at $135.55, line a. The weekly Nasdaq 100 A/D line is now closer to its uptrend (line b) and the WMA. The daily A/D line has not made new lows and a close above Friday’s doji high at $142.20 would be a short term positive.
The SPDR Dow Jones Industrials (DIA) caught up with the other major ETF tracking ETFS last week as it dropped well below the prior low at $218.52. The close was below the daily starc- band with the monthly pivot support at $214.42. The daily Dow A/D line has made lower lows.
The iShares Russell 2000 Index (IWM) continues to look the weakest as it is again closest to the daily starc- band with the weekly at $132.26. The weekly and daily Russell 200 A/D lines are still in solid downtrends with no signs yet that their correction is over.
A drop down to the $240 level in the SPY would be a 3.6% correction from the highs while a 5% correction would mean a drop to the $236.50 area. The chart of the QQQ currently is acting better and a 3.5% correction in the QQQ would mean a drop to the good support in the $137 area. At this point I do not think a 7.4% decline like 2013 is likely.
The Economy
Very strong data last week but it did not stop the market from correcting. Retail sales were double what was expected while the Empire State Manufacturing Survey came in at 25.2 but the economists were expecting 9.8. It was the highest reading since September 2014. The Housing Market Index was also well above consensus estimates.
Housing Starts were weaker than expected but it is not yet a trend. The Philadelphia Fed Business Outlook Survey was strong again this month but Industrial Production was a bit lower. Thursday’s Leading Indicators came in at 0.3% and is still in a positive trend. The mid-month reading on Consumer Sentiment was strong at 97.6 well above last month’s closing reading of 94.
This week we have the Chicago Fed National Activity Index on Monday followed Tuesday by the Richmond Fed Manufacturing Index. For the housing market we get New Home Sales on Wednesday with Existing Home Sales on Thursday. Also on Thursday we have the flash reading on the PMI Composite that is followed Friday by Durable Good Orders. The meeting of the central bankers at Jackson Hole may have some surprises.
What to do? The evidence last week favored a failing rally and the sharp decline on Thursday has kept the A/D lines in the corrective mode. It would take several consecutive days of very strong A/D numbers to turn the A/D lines less negative.
A more complex corrective pattern that lasts a few more weeks seems likely especially since there has been no spike in bearish sentiment. In last week’s AAII survey the bullish % rose 0.5% to 34.2% but after Thursday’s drop they are likely to move lower this week. I would still expect lower bullish sentiment before a sustainable bottom is in place.
For Viper ETF traders I will continue to favor trading the short side of the market using leveraged inverse ETFs. For investors I will be watching the decline for signs of which ETFs may become leaders once the correction is over.
Viper Hot Stock traders are still more heavily weighted on the short side though there are a few tech stocks that appear to be bucking the downward trend
If you are interested in following the analysis of the A/D lines I hope you will consider a subscription to either the Viper ETF Report or the Viper Hot Stocks Report. Each service includes two 4-5 page reports each week where I teach you about the markets as well as provide specific buy and sell advice.
Each service is only $34.95 per month and can be cancelled on line at any time.
If you have not read it yet you may want to download a copy of my eBook. As part of the sign up process you will also be added to the email list for the free Viper Reports. I send out market commentary and technical tips several time a week. Additional market comments are also often posted on the Viper Report Facebook page.
Comments
comments