

The weak inflation data since the start of the year had convinced most Fed watchers that the FOMC would not act on rates in September and maybe not this year. Their announcement last week makes a rate hike likely in December and further rate hikes cannot be ruled out in 2018.
The yield on the 10 Year t-Note broke support, line c, on September 5th and yields dropped to a low of 2.034% before reversing to the upside. The yield hit a high of 2.289% last week. The daily downtrend, line b, and starc+ band are at 2.357% with more important resistance at 2.423%.


The daily MACD-His turned positive on September 12th, point 2. This reversed the negative signal that had been in force since July 18th , point 1, when yields were above 2.300%. The daily MACD is still positive but has lost some upside momentum. The weekly MACD turned negative in February and has not yet bottomed out.


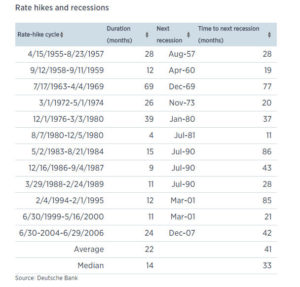
The research from Deutsche Bank details all of the rate hike cycles doing back to 1957. It reveals that on average it takes 41 months from beginning of a rate-hike cycle before a recession starts.


When the Fed started to raise rates on June 30, 2004 the NYSE was already correcting from the highs early in the year. The NYSE A/D line was acting stronger than prices as it made a new high (line 1) the week ending July 2, 2004 as it had moved through the resistance at line a. The NSYE Composite declined for six more weeks before the correction was over and it was making new highs by November.
The stock market continued higher for almost three years. When it topped out in October 2007 it was up 53% since the Fed started to raise rates. The recession officially started in December 2007.
There was also a rate hike cycle that began on February 4, 1994 when the S&P 500 was at 469. This cycle only lasted until February of the following year but the S&P 500 stayed in a trading range and was unchanged for the period. As I have mentioned several times in the past the early stages of a higher rate cycle can be a bullish period for stocks.
As noted in a Business Insider article in 1999-2000 the S&P 500 was down 3.2% in the month after rates were raised but was 6% higher in the next twelve months. Many are aware that in February 1987 the Fed “sold $8.4 billion of securities, withdrawing liquidity from the market and forcing the Fed funds rate up”.
Interest rates rose until October but in August the NYSE A/D line had formed a significant bearish divergence and topped out. The A/D analysis was negative several weeks before the stock market crashed.
Higher yields are likely to cause a further rally in the dollar which has been the favorite short position of many hedge funds. According to Bloomberg “Over the past week, nearly $13 billion more dollar calls, which give the right to buy the currency, have been bought than puts”.
Last week I examined crude oil and gold (Top Technical Tool For Commodities) using my analysis of the Herrick Payoff Index (HPI). The HPI incorporates the open interest, volume and price to determine the money flow in or out of a commodity.


The HPI often gives signals that are contrary to the positions of the big hedge funds or money managers. They were short going into the latest rally in crude oil. The weekly chart of the Dollar Index shows its steady decline for most of 2017 as it has dropped from 103.80 to 91.98.
The weekly OBV has now moved above its downtrend, line a, and its WMA. The weekly HPI dropped below its WMA just after the highs but it is now close to turning positive.
On the bottom of the chart is plotted the CFTC’s COT data on the short positions of the large speculators. By looking at the chart it is clear that these traders were not very short as the dollar topped out but started to add to their short positions in May after the Dollar Index had already had a significant decline.
The high level of short positions currently means it is clearly a crowded trade. The Euro zone economic data late last week dampened the dollar’s rally. It would not take much of a rally in the Dollar Index to make those on the short side nervous. Once a rally gets underway it could cause quite a squeeze as those on the short side are forced to cover.
Even the long awaited FOMC announcement last week was not enough to expand the ranges in the stock market as the S&P 500 was up 0.08% with the Dow Industrials gaining 0.36%. For another week the small cap Russell 2000 was the star performer as it gained 1.33%.
The Dow Transports also did well gaining 1.66% while fears of higher rates hit the Dow Utilities which were down 2.63%. The NYSE A/D ratio was positive with 1749 stocks rising and 1317 declining.

The daily chart of the NYSE Composite shows that it is still trading near the upper boundary of its trading channel, line a, and the quarterly pivot resistance at 12,154. The daily starc+ band is at 12,229 with the weekly at 12,243,
The weekly and daily NYSE A/D lines both made new highs last week. The daily A/D has moved above the resistance at line c, as it is acting stronger than prices. The A/D line is well above its rising WMA and shows no signs yet of topping out.


The daily chart of the Spyder Trust (SPY) shows the narrow ranges of the past two weeks (see highlighted section). The rising 20 day EMA at $247.44 is 0.8% below Friday’s close. The monthly pivot is at $246.08 with the rising 20 week EMA at $242.57. This is just below the support from the April lows, line a.
The weekly S&P 500 A/D line made a new high last week as it is well above the rising WMA. The daily A/D line still is clearly positive but if it starts to flatten out in the next week or two it could warn of a correction. There is good A/D support now at line b. The daily OBV is still leading prices higher.
The PowerShares QQQ Trust (QQQ) was down almost 1% for the week but both the daily and weekly A/D lines closed the week above their WMAs. There is next good support is in the $142-$413 area. A move above $146.70 is needed to turn the daily momentum positive.
The Economy
The focus last week was on the FOMC but there were a number of important economic reports. The housing data was mixed as Existing Home Sales were likely depressed by the hurricane in Houston.


The Philadelphia Fed Survey at 23.8 was much better than the consensus estimate of 18 as new orders were especially strong. The chart shows that the survey had pulled back to its support before turning higher this month.
The Leading Indicators were also very strong as it rose 0.4% double the expected increase. It shows no signs of topping out which is a plus for the economy as we move into 2018. The flash reading on the PMI Composite Friday held up well despite the impact of the hurricanes.
On Monday we have the Chicago Fed National Activity Index and the Dallas Fed Manufacturing Survey. This data is followed by the S&P Corelogic Case-Shiller Housing Price Index, New Home Sales, Consumer Confidence and the Richmond Fed Manufacturing Index.
On Wednesday we have the Durable Goods report and Pending Home Sales with the final reading for the 2nd quarter GDP on Thursday. To end the week we get the Chicago PMI and Consumer Sentiment.
What to do? The focus this week is likely to be on interest rates and the economy. So far the reaction to the FOMC announcement has been muted. There is plenty of economic data this week but the GDP report may get the most attention. The reports are unlikely to move the market but more strong data should fuel the optimism for the earning’s season.
The narrow ranges in the Spyder Trust (SPY) makes me a bit more cautious over the near term as it suggests that it would not take much selling to trigger a sharper correction. The positive weekly analysis does suggest this will be a buying opportunity.
Viper ETF traders are still holding a number of long positions as they bought the SPDR S&P Oil & Gas (XOP) near the recent lows. Investors are looking for a pullback to buy the energy ETFS as the weekly indicators are now positive. There are a number of ETFs that are being watched for new positions.


There are a number of stocks that have been performing better than the market averages. Viper Hot Stock traders took a 19.3% profit in their position in Micron Technology (MU) as it had reached my price targets. We also sold 50% of the long positions in Netflix (NFLX) for a double digit profits as they reduced the risk on their position.
In my Viper ETF Report and the Viper Hot Stocks Report, I provide market analysis twice a week along with specific advice. I will also help you better understand the markets for only $34.95 each per month.
Comments
comments