

The monthly jobs report came in lower than expected on Friday but that did not stop the stock market from recording a powerful week of gains despite the increasing doubt of many investors. There were a number of sectors like health care that completed their trading ranges last week and the beaten down small cap stocks also put in a strong performance.
In terms of the technical outlook the action last week was not surprising. The strong weekly and daily analysis of the market pointed to higher prices this month and it has gotten off to a strong start.
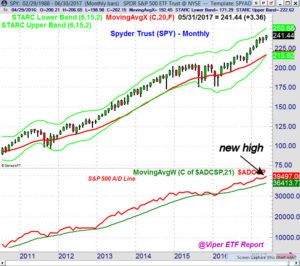

The monthly chart of the Spyder Trust (SPY) still looks strong as it gained 1.4% with the next major upside target in the $248-$250 area. More importantly the monthly S&P 500 A/D line made another new high in May as it has been leading the market higher since the spring of 2016. The long term chart the NYSE A/D line I published a year ago illustrates that it has done a good job of forecasting the major turns since 2003.
Individual investors became more nervous according to the latest AAII survey as the bullish % dropped 5.9% to 26.9%. This is well below the long term average of 38%. This is a good sign for the markets as low bullish sentiment with positive technical readings means the rally can continue.
So what is keeping investors so cautious? The policies of the new administration are a concern for many but the doubts stirred by some high profile bearish investment expert helps to keep investors on the sidelines. Each time one of these perpetually wrong guests is invited again to appear on a leading financial station I have to ask myself why?
There are three possible explanations, the producers do not research the guest’s background, they are desperate for content or the guest has a great PR firm. It has been almost a year since I have focused on this subject (The Week Ahead: Investors - Look Before You Leap) and I still do not have an clear answer. My best guess is that they are desperate for content or that the guest has a well-connected PR firm.
I refuse to believe that it is just because they do not do their own research. As I wrote last year “Thanks to the internet you are now able to research the past history of any advisor or expert you are thinking about following. If they are very bullish or very bearish you want to find out whether they have had this view for a few months or a few years. In the odd chance you can't find anything then you should start taking notes of their advice and then study them before you make a decision.”
Don’t get me wrong as though I am all for a free exchange of a wide range of opinions I am not convinced that there is any value to the investing public in having a guest like Dr. Marc Faber (Dr. Doom) regularly warning of a market collapse, recession or a war as he has been suggesting throughout the bull market.
In his spot on CNBC last week "We have a bubble in everything," Marc Faber, editor of The Gloom, Boom & Doom Report, told CNBC on Wednesday. Oddly enough in a CNBC performance on September 19, 2014 he was also seeing “Bubbles Everywhere”.
According to Wikipedia “In 2012, Faber claimed that there was a "100% chance" of a global economic recession later that year or in early 2013.[17][18] As they note “Subsequently, the average world product grew steadily by 3.4% in each of 2012, 2013 and 2014, and 3.5% in 2015”. Over the years he has also warned investors that they are on the Titanic.
My goal is not to point out the short comings of another analyst but is designed to convince investors to always think critically in order to be successful. It has long been my belief that anyone who is willing to devote the time and energy can become their own investing expert or advisor.
Though my major trend analysis has been positive on stocks since the spring of 2009 the corrections in July 2011 and early 2016 were more severe than I expected. I have been fortunate to correctly identify every correction low since 2010 including the bottom in February 2016. My Forbes articles since 2011 can be found on my archive.
I would encourage both new as well as seasoned investors not to allow anyone’s opinion to change your strategy until you have looked back at their previous comments. I also think it is critical that everyone employ risk management in their investments so if you are wrong it does not seriously damage your portfolio. Very few of the lifelong market bears give any parameters as to what might change their view.
Show casing these perpetual bears in my opinion does a disservice to the investing public which is the financial media’s primary audience. Unfortunately none of the networks seem to care or are interested in obtaining any critical input on their programming.
Certainly the perpetual bears, and there are many others beside Marc Faber, may be right one of these years but does anyone think they should have been out of the stocks for the past seven years? It is particularly hard to justify after several market sectors completed their trading ranges last week.
For a technical analyst the bullish completion of trading ranges are very important as they indicate that demand has surpassed supply. These moves are often difficult to explain from a fundamental standpoint but to a technical analyst it does not matter.
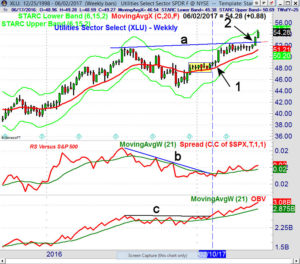

The action in the Utilities Sector Select (XLU) this year is a good example. In February 2016 the XLU completed an eight week trading range, point 1. The action was confirmed by the relative performance breaking its downtrend, line b. With the Fed planning three rate hikes in 2017 why would an interest rate sector turn higher?
The on balance volume in February moved through resistance going back to July 2016 and as a result it was recommended to Viper ETF investors. Just two weeks ago (point 2) the XLU moved above the 2016 highs which completed an even more significant trading range, line a. This ETF is up 12.6% YTD and is yielding 3.12%.
There are several other sector ETFs which completed their trading ranges last week which means that all buyers of the ETFs are now holding a profit. Often times there are retests of the breakout levels which will provide additional buying opportunities. False breakouts are rare but that is the reason why risk needs to be controlled for any investment or trade.
The Economy
Though Friday’s job report was weaker than estimated the unemployment rate hit the lowest level since 2001. This increases the odds of a rate hike by the Fed in June. However an interesting Bloomberg article suggests that the Federal Reserve is now becoming concerned that the Trump administrations immigration policy may be limiting further gains in employment. This could be a drag on the economy.
In a holiday shortened week the economic data was positive as Tuesday’s Consumer Confidence held firm. The Dallas Fed Manufacturing Survey, Chicago PMI as well as the PMI and ISM Manufacturing readings met or exceeded estimates last week.
This week the data is concentrated on Monday with the PMI Services Index, the ISM Non-Manufacturing Index and Factory Orders.
Interest Rates & Commodities
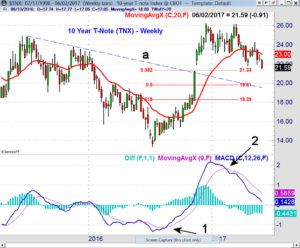

The yield on the 10 Year T-Note dropped last week below the April low of 2.177% which reaffirmed the negative trend and downward momentum. The major 38.2% support is at 2.133% with the 50% support at 1.981%.
The former downtrend, line a, is now below 2.000%. The MACD turned negative on February 17th (point 2) which reversed the buy signal from August 2016, point 1. The daily momentum is also negative and the completion of the two month trading range has downside targets in the 2.00% area.
As I noted last week the technical outlook for crude oil was not changed by the rally from the May lows which suggested that a drop back or below the recent lows was likely. Crude oil was down 4.3% last week with monthly pivot support at $44.60.
Market Wrap
The market’s mild pullback early in the week was consistent with the bullish technical readings (Will The Charts Be Right Again in June?) though only the small cap IWM and NYSE Composite made it to stronger support before turning higher. The Russell 2000, Dow Transport and Dow Utilities all gained close to 1.7% while the S&P 500 was up just under 1%.
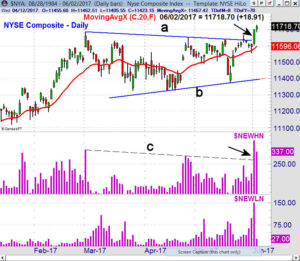

The weekly market internals were strong again last week with 1976 stocks advancing and just 1109 declining. The NYSE Composite pulled back just below the 20 day EMA on Wednesday before it accelerated to the upside completing the trading range, lines a and b. The upside targets are in the 12,000 – 12,200 area. The number of NYSE stocks making new 52 week highs surged last Thursday breaking the downtrend, line c.
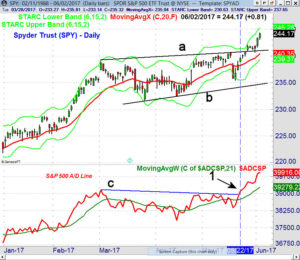

The weekly S&P 500 A/D line had broken out to the upside in late May and the Spyder Trust (SPY) had completed its trading range. The daily S&P 500 A/D line broke out to the upside on May 22nd (point 1) as I noted in my May 23rd Tweet. The SPY did not break out of its trading range (lines a and b) until three days later as once again the A/D line led prices higher. The A/D line is well above its strongly rising WMA.
The daily starc+ band is at $245.28 with monthly pivot resistance at $249.75. There is minor support now at $241-$242 area with the rising 20 day EMA at $240.35.
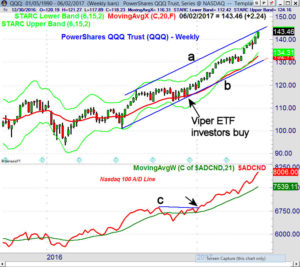

The PowerShares QQQ Trust (QQQ) was up 1.60% last week as it again closed at the weekly starc+ band and reached June’s initial monthly pivot resistance at $143.47. The upper boundary of the trading range, line a, has also been reached. There is further pivot resistance at $145.64.
The move in the Nasdaq 100 A/D line above its resistance, line c, in early January confirmed the bullish outlook. The A/D line made a new high again last week as it has been accelerating to the upside. The daily Nasdaq 100 A/D line also made further new highs last week. There is initial support at $140.50- $141 with the sharply rising 20 day EMA at $139.43.
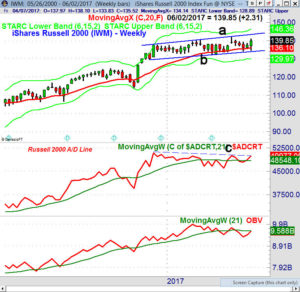
The iShares Russell 2000 (IWM) dropped to a low of $143.64 and held above the recent low at $134.23 before turning higher. IWM closed well above the flat 20 week EMA and the prior three week highs. There is next resistance at $141.82 with monthly pivot resistance at $145.37. The weekly starc+ band is at $146.46. A completion of the trading range has upside targets in the $150-$152 area.

The Russell 2000 A/D line has moved further above its WMA and is very close to breaking through resistance at line c. The weekly OBV has turned higher and should move above its WMA with a higher close this week. Viper ETF investors and traders went long IWM on the pullback last week.
What to do? The bullish action of both the daily and weekly A/D lines does favor higher prices in the week ahead but the technology stocks are extremely overextended so we may see some sector rotation over the next few weeks. The strong rebound in the small caps suggests they may be ready to lead on the upside but a further rally is needed to confirm.
There are a number of sector ETFs that have either just broken out to the upside or are on the verge of completing their trading ranges. Given the market’s recent gains a 1-2% pullback is possible at any time but it should be a buying opportunity.
Viper ETF subscribers are long technology, health care, materials, industrials, biotech as well as positions in the emerging markets and overseas markets.
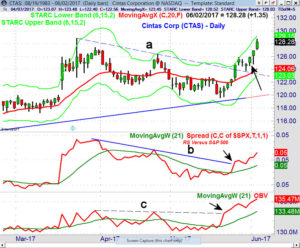
There have been a number of good trading opportunities for Viper Hot Stock traders over the past few weeks as there have been some very good buy setups. A good example was Cintas Corp. (CTAS) which broke its downtrend, line a, in late May and retested the breakout level last week where additional longs were added. Both the RS and OBV had confirmed the breakout giving buyers much more confidence.
I still recommend scaling out of longs on strength as sold 50% of the long positions in Micron Technology (MU) for a quick 12.5% profit last Wednesday.
If you are interested in specific buy and sell advice you might consider a one-month investment of just $34.95 for either the Viper ETF or Viper Hot Stocks service. Both services include two in-depth reports each week and subscriptions can be cancelled on line at any time.
Comments
comments