

The eight-day $120 rally in gold in reaction to the Brexit vote cleaned out those who remained on the short side and caused a new flood of buying as the long side of the gold market became even more crowded
As I pointed out on July 9th "The latest data from the CFTC shows that the long positions of money managers have made another new high even though margins were recently raised. In my experience this is a dangerous combination and I continue to think the long side is risky now."
In trading Wednesday gold futures are down $14 but many are confident the rally from the early 2016 lows is not over yet. The December Comex gold contract has dropped $60 per ounce from the July 7th high as even the events in Turkey could not interrupt the decline.
In over 30 years of analyzing the commodity markets I have paid particular attention to the open interest in order to identify both long and short-term turning points. This open interest analysis in January "Time To Squeeze The Short Oil Speculators?" indicated that the four-month slide in crude oil prices was likely to reverse. Crude oil completed its bottom just a few weeks later.
The number of long gold contracts held by money managers only dropped 3% in the latest period as their long position represents 33.4% of the open interest. Since late 2015 the number of long contracts held by money managers has surged 220,000 contracts. This suggests that more longs will be liquidated before the bullish sentiment has been significantly reduced.
So what do the monthly, weekly and daily charts say about the outlook for gold futures?
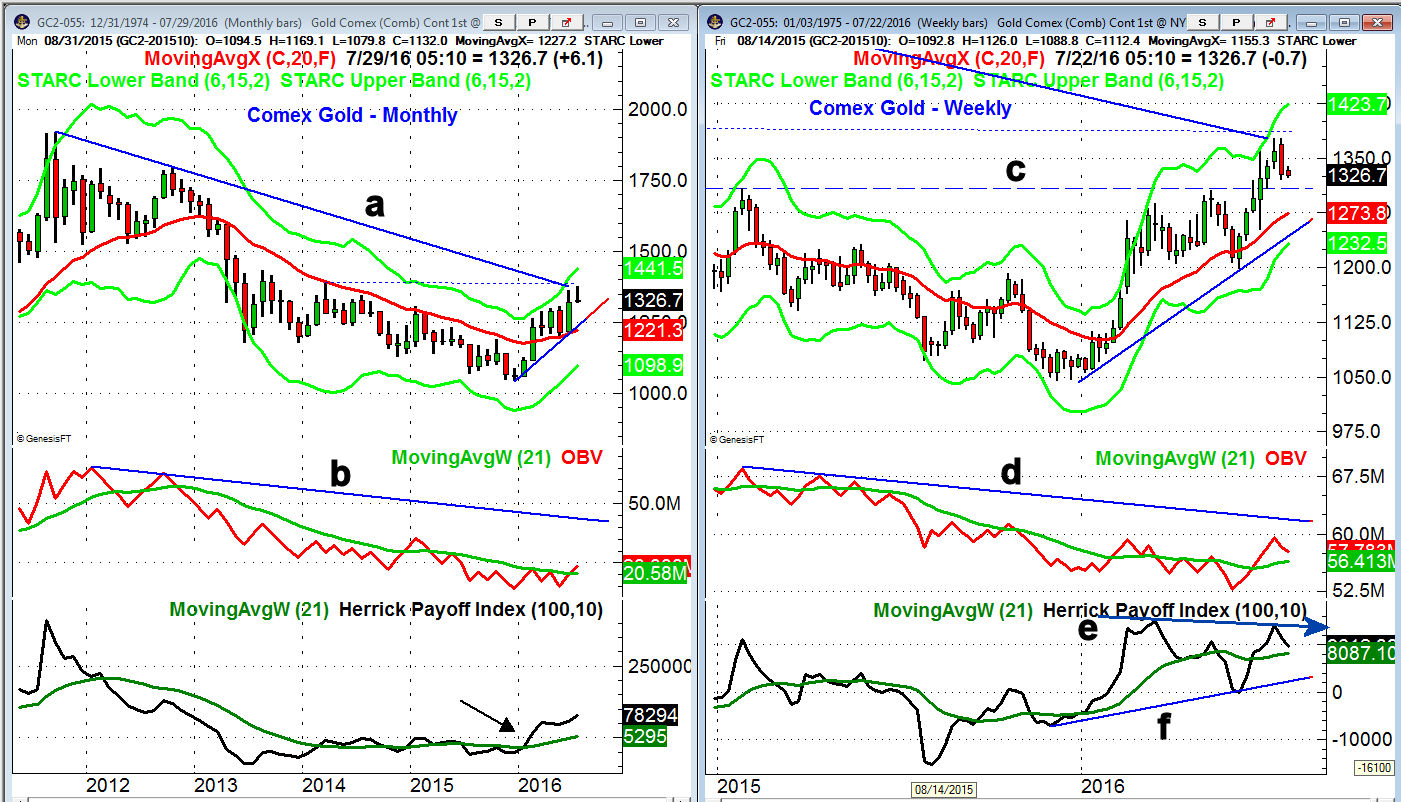
The monthly chart of gold futures shows that the futures formed a doji in December 2015 and then triggered a buy signal with the January close. (Chart is updated through 7/19)
- The monthly downtrend from the 2011 and 2012 highs has now been reached.
- Currently the gold futures are trading near the month's low so the July close will need to be viewed in terms of the monthly open at $1324 to see if another doji has formed.
- There is monthly support at $1220 which corresponds to the 20 month EMA.
- Since prices are currently slightly higher for the month the OBV is slightly above its WMA but it has been weak on the rally.
- The Herrick Payoff Index (HPI), which uses volume, open interest and prices is showing the best strength since 2009.
- The HPI moved above the zero line at the end of February, point 1 and is still clearly positive.
- The WMA of the HPI could move above its WMA in July for the first time since late 2013.
The weekly chart shows last week's reversal as the close was well below the prior week's low. There is first good support in the $1295-$1305 area with the quarterly pivot at $1294. (Chart is updated through 7/19)
- The rising 20-week EMA is at $1272 with the uptrend in the $1240 area.
- The weekly starc- band and the quarterly pivot support are in the $1230 area.
- The weekly OBV only moved above its WMA four weeks ago as it made new lows in late May even though prices were moving higher.
- The OBV is still well below its long-term downtrend, line d, that goes back to early 2015.
- The weekly HPI moved above its WMA and the zero line at the end of January which was bullish.
- The HPI has been lagging prices since early June as it has formed a significant bearish divergence, line e.
- A decline in the HPI below the previous low and the zero line will confirm the negative divergence.
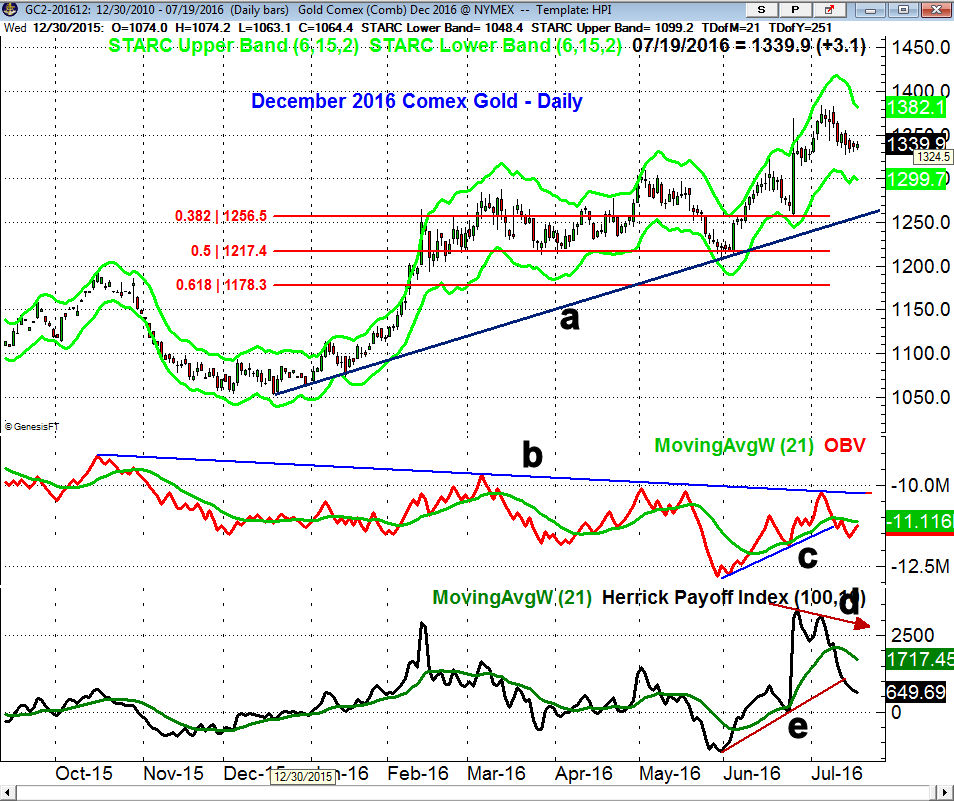
The daily chart of the December 2016 Comex gold contract is updated through Tuesday July 19, 2016. Therefore it does not reflect the $14 drop on Wednesday as December gold is currently trading below $1326.
- The daily starc- band is at $1299 while the 38.2% Fibonacci support from the December 2015 low is at $1256.50. The daily uptrend, line a, is in the $1250 area.
- The 50% support is at $1217.40 and it should hold on a correction as it is likely to terminate between the 38.2% and 50% support levels.
- The daily OBV has formed lower highs since last October as it has diverged from prices.
- The OBV dropped below its WMA on July 12th and this weakness was confirmed by the break of the uptrend, line c, late last week.
- The daily HPI formed a negative divergence, line d, at the recent highs.
- The violation of the support at line d generated a further sell signal.
- There is initial resistance now in the $1235-$1240 area.
What it Means: As the charts indicate the monthly, weekly and daily technical studies looked negative before the drop on Wednesday. Vipers ETF client have been on the sidelines as I became skeptical of the rally in June.
I do think that the current correction is likely to be an excellent buying opportunity consistent with the bullish monthly indicators. I will be monitoring the weekly and daily technical studies for signs of a turn.
The Market Vectors Gold Miners (GDX) is down over 4% at $28.40 early Wednesday and has first strong chart and retracement support in the $23.50-$25 area. The SPDR Gold Trust (GLD) is down over 1% at $125.82 and has next good support in the $123-$124 area. The 38.2% support at $119.19 may be tested on the decline. I am also watching the iShares Silver Trust (SLV).
I would expect the decline to last a few more weeks at least. It typically takes some time to reverse such high bullish sentiment.
Comments
comments