


Sep 26, 2021,03:29pm EDT: There was plenty of investor and trader angst at the start of last week, consistent with the prior week’s sharp decline in the Bullish% figures from the American Association of Individual Investors. On September 8, 38.9% of individual investors were bullish, but the following week only 22.4% were bullish. The Bearish% rose from 27.2% to 39.3% during this period.
Given my technical appraisal of the stock market two weeks ago, I was surprised that investors and traders were not more worried about the stock market. As has recently been the case, the dip buyers moved quickly and started buying before the close on Monday. Stocks then moved higher for the rest of the week. By last Thursday’s AAII survey, the Bullish% had increased to 29.9% from 22.4%, while the Bearish% was virtually unchanged.
Though some downplayed its impact on the US market, the debt crisis surrounding Chinese conglomerate Evergrande is seen as a primary factor in Monday's decline, as the firm owes $305 billion and missed a payment deadline to investors this past week. Investors were also nervous over concerns that the economic recovery has lost strength and the persistent spread of COVID-19.

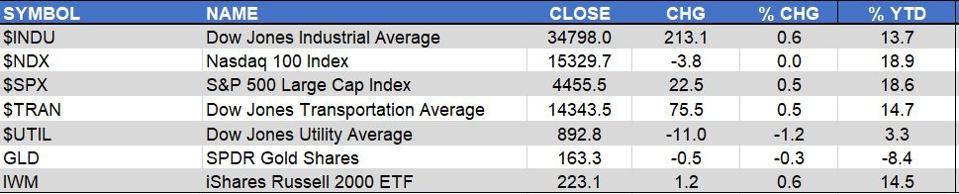
For the week, the Dow Jones Industrial Average and iShares Russell 2000 were up 0.6%, just a bit better than the 0.5% gains in the S&P 500 and Dow Jones Transportation Average. It was a rough week for the Dow Jones Utility Average, as it lost 1.2% and the SPDR Gold Shares was 0.3% lower.
So did the rebound from Monday’s lows and rally through the week signal that the market’s correction is over? The daily market internals were positive early on in the rebound, but for the week on the NYSE there were 1721 issues advancing and 1762 declining.

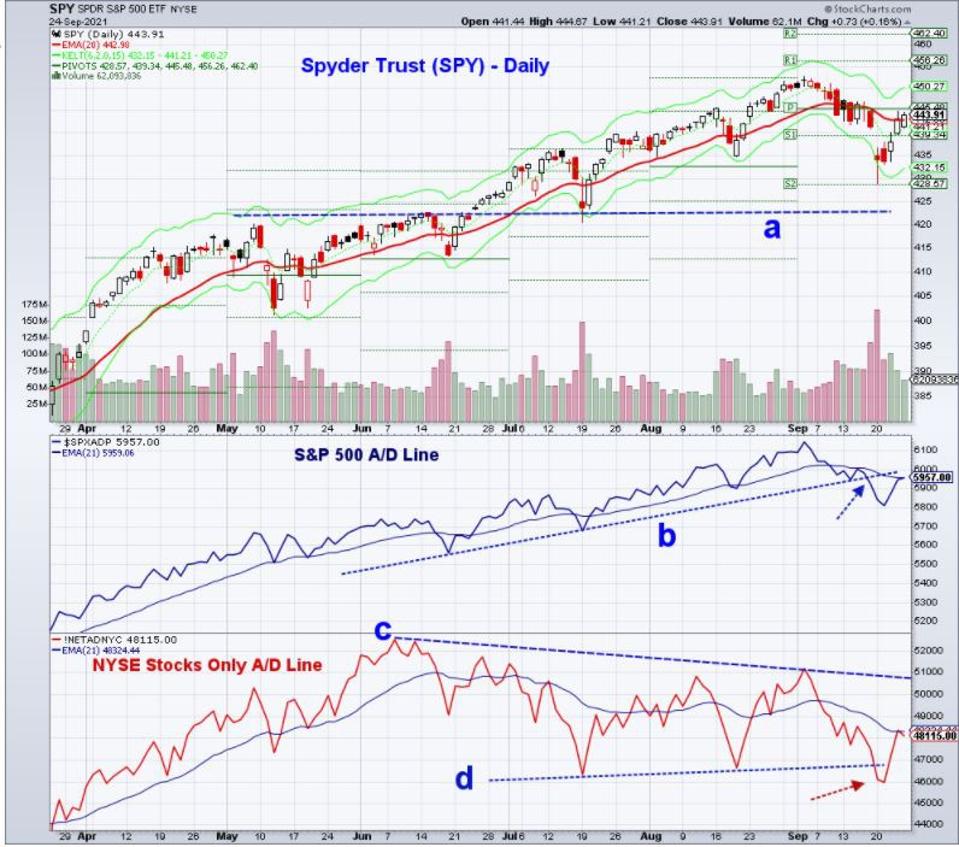
The Spyder Trust (SPY)SPY had a low Monday of $428.86, which was just above the monthly S2 support at $428.56. There is additional support in the $423-area at the June high and July low (line a). SPY closed the week at $443.91, which was above the 20-day exponential moving average (EMA) at $442.98 but below the monthly pivot at $445.48.
There were strong bullish signals for the market in early June from the advance/decline lines. The challenge for the market for the past few months is illustrated by the differences between the S&P 500 and the NYSE Stocks Only Advance/Decline lines. In July, August, and early September the S&P 500 A/D line made new highs but then dropped below support (line b) on September 17. The A/D line has rallied back to its flat EMA, but is still below its former uptrend and resistance.
In contrast, the NYSE Stocks Only Advance/Decline line made its high on June 8, and has since formed a series of lower highs (line c). This was a sign that a majority of common stocks were not in the same positive trend as the S&P 500 or Nasdaq 100 stocks. On top of that, the NYSE Stocks Only A/D line's drop below the support from July and August (line d) was also very much a sign of weakness. This A/D line has rebounded back to its EMA, and now needs to overcome the resistance (line c) in order to turn positive.

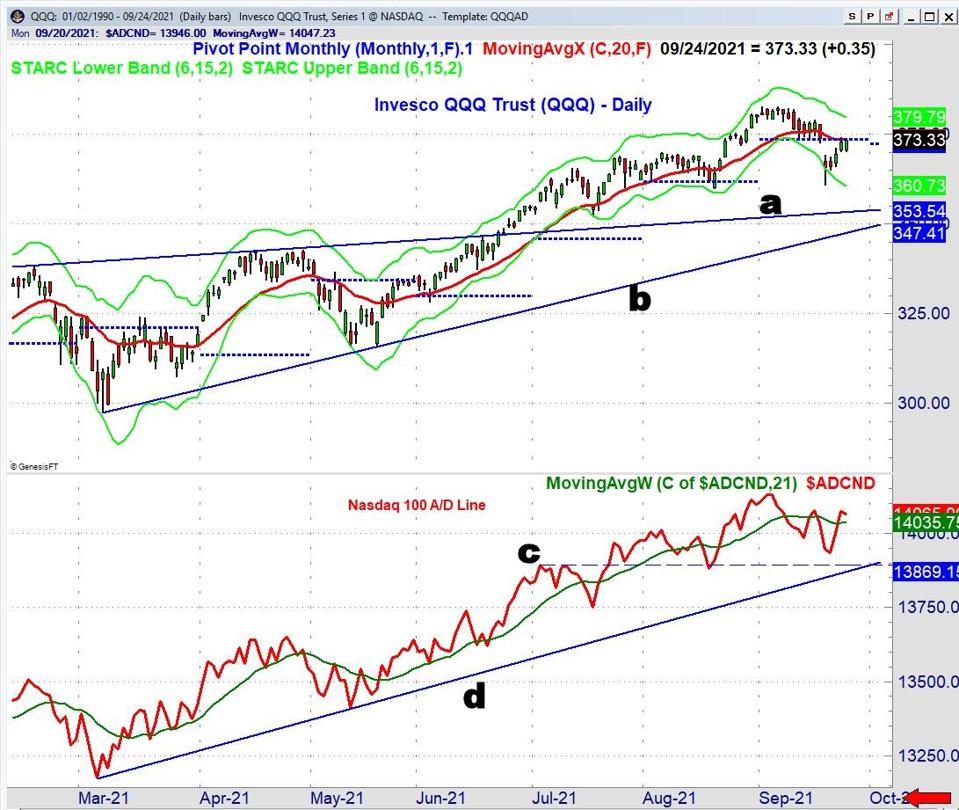
The Invesco QQQ Trust (QQQ)QQQ has been stronger year-to-date than the SPY. It had a high of $382.35 on September 7, and a most-recent low of $360.93 on Monday. From the high to the low, it was a decline of 5.6%. QQQ had dropped well below its daily starc- band on Monday, and thus was in a high-risk sell and low-risk buy area. The rebound has taken QQQ back to its monthly pivot at $373.56 and its 20-day EMA at $373.26. There is additional resistance in the $379 area.
The Nasdaq 100 Advance/Decline line has made a series of higher highs in 2021, with the last new high on September 3. The A/D line dropped below its weighted moving average on September 9, and has made lower highs since then. It closed Friday just barely below the prior peak. A strong move above this high would be bullish for the QQQ, which has next good support at lines c and d.
The results of my regular weekly stock scan support the view of a split market. There are a number of stocks whose charts and technical studies favor buying, while there are also a number that look attractive on the short side.
It is my view that all successful investors and traders need to understand and trade stock market corrections. I have examined market declines or corrections going back to the 1960s, and though none are exactly alike, they do have similarities. The stock market risk has been lowered by last week’s drop, but the split nature of the market behavior indicates that the market is not yet ready for a broad new market uptrend like the one which began in November of 2020.
I am expecting that in the next 2-4 weeks, the bullish case will become stronger. However until then, I would continue to recommend only very selective buying where there is good support and where the risk can be well-controlled.
Comments
comments