

The stock market had been in the correction mode since the first part of August when I commented that “it is not a time to be aggressive on the long side”. The turnaround on Tuesday after the sharply lower opening indicated a shift was underway. The strength of Nasdaq 100 A/D line was evident by Wednesday’s close but the other A/D lines did not overcome their resistance until the end of the week.
In last week’s column I noted that a typical correction could take the major averages down 5-7% but only the small cap Russell 2000 had declined that much as it was down 7% at one point from the late July highs. At the lows the QQQ was down just 3.9% while the SPY was only down 2.8%.
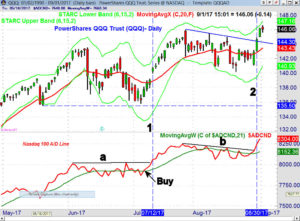

The classic correction in the QQQ from the early June high to the July low was a decline of 5.4%. It ended right on schedule as Viper ETF traders bought two days after the lows and the bullishness was confirmed when the A/D line moved to new highs two days later as the resistance at line a, was overcome.
Trading longs were sold before the wild reversal on July 27th as subscribers to the free Viper Report email were advised not to be greedy. The lack of any meaningful correction in 2017 and the rising bullishness made a more severe correction possible in early August once the A/D line started to decline, line b.
After entering the corrective mode the QQQ did have sharp declines on August 10th and 17th but there was very little follow through selling. The A/D line moved above its WMA Tuesday and overcame the downtrend (line b) with Wednesday’s close.
It is very difficult to avoid 2-4% corrections but in over 30 years of market experience I have found it can be treacherous to ignore the A/D line when it sends you a warning. Even if there are no weekly divergences in the A/D lines a 5-10% decline cannot be ruled out but a period of consolidation is also possible.
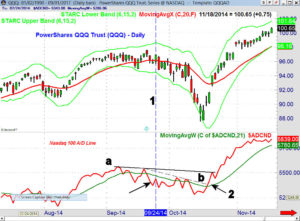
The action in September 2014 illustrates this point. By the 2nd week of September 2014 the Nasdaq 100 A/D line had entered the corrective mode and the new price high on 9/19 caused the formation of a bearish divergence in the A/D line, line a. The sharp drop after the high (see arrow) pushed the A/D line firmly into the corrective mode. The brief bounce on September 24th (line 1) created a good selling opportunity as the A/D line failed well below it’s declining WMA.
The market drifted lower for a few days before it dropped down towards the daily starc- band and formed a doji. QQQ then bounced back to its declining 20 day EMA for several days. As I discussed in a recent Viper Trading lesson (sent to all new subscribers) it is a very valuable tool to identify good selling as well as buying opportunities.
The selling picked up in early October as the QQQ dropped from $94 to $87.60. The correction took the QQQ 10.2% lower and was clearly worth avoiding. The warning signs from the A/D lines made one prepared for such a decline.
Just three days after the lows the A/D line broke through its short term downtrend, line b, indicating that the worst of the selling might be over (point 2). The more important resistance, line a, was overcome six days after the lows confirming that the market’s uptrend had resumed.

I have observed many examples of the A/D lines entering the corrective mode. These two examples may help you better understand what can happen when the A/D lines enter the corrective mode when no weekly negative divergences are evident.
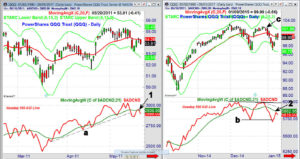
In early May of 2011 the Nasdaq 100 A/D made a new high and formed twin tops before dropping below its WMA and support at line a. This meant that it had entered the corrective mode. The rebound in the QQQ from the daily starc- band failed at the 20 day EMA.
The A/D line briefly moved above its WMA, point 1, before it turned lower which was consistent with a failing rally. From the May 2nd high at $55.37 the QQQ eventually dropped to a low of $50.02 on June 17h which was a decline of 9.6% in just six weeks.
In 2014 (chart on the right) the QQQ peaked at the end of November. The A/D line dropped below its WMA eight days after the high and the QQQ soon corrected sharply back to the daily starc- band. The fact that the A/D line dropped below the November lows was a sign of weakness that suggested the next rally would fail.
The QQQ did not reach the previous highs but the A/D line did test the former highs before the doji sell signal (point c). The Nasdaq 100 A/D then dropped below its WMA and the break below the prior lows, line b, was a sign of weakness. The rebound in the A/D line failed below its WMA (point 20 before it turned lower. The January low at $96.81 was just barely below the November low as during this correction the QQQ dropped 6.1%.
When there are divergences in the weekly A/D lines then the strategy must be very different as double digit declines are more likely. After making a new high in May 2015 the weekly S&P 500 A/D line dropped below its WMA in June, point 1.
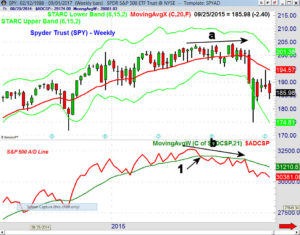

As the Spyder Trust (SPY) continued to move higher in July, line a, the A/D line made lower highs, line b. There were two instances the A/D line rebounded back to its declining WMA but failed to move above it and then turned lower.
Throughout the summer I warned about the market’s deteriorating condition and I advised not to do additional buying as a correction was very likely. (See The Week Ahead: Greece Isn't The Real Problem and The Week Ahead: Should You Trust This Rally?)
In my August 20th article from 2015 I commented “The downtrends in the market's advance/decline lines have pointed to a market correction since June and while they tried to firm on Monday they have again dropped sharply with Wednesday's close. Before this market can complete its correction we need to see signs of capitulation and panic selling”.
The next day the Dow fell 3% and the following Monday the Dow was down 1100 points in the first five minutes of trading. The weekly chart shows that the SPY had a low of $174.97 (point 2) which was well below the weekly starc- band. It was not until early October that the daily A/D line again turned positive.
The good news now is that there are no significant weekly divergences in any of the A/D lines. For the week the Nasdaq Composite and Russell 2000 were up over 2.5% as were the Dow Transports. The Dow Industrials gained 0.80% but the S&P 500 was up 1.37%. The NYSE A/D numbers were strong with 2210 issues advancing and just 867 declining.
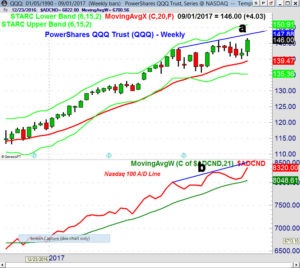

For the month the S&P was just barely higher with the Dow up 0.3% and the Nasdaq Composite was up 1.3%. The PowerShares QQQ Trust (QQQ) was up 2% for the month as the low at $140.18 was well above the prior month’s low. The rising 20 week EMA and chart support are now in the $139.47 area.
The weekly chart resistance, line a, is at $147.88 with initial monthly pivot resistance at $148.22. The weekly starc+ band is at $150.91. The weekly Nasdaq 100 A/D line has made a new all-time high with trend line resistance at line b. The new monthly pivot is at $144.20 with the 20 day EMA at $143.42.
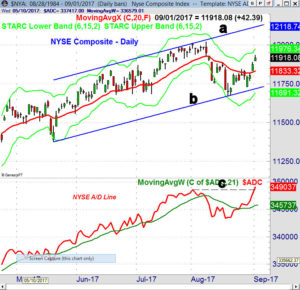

The broadly based NYSE A/D line also made a new high last week closing above resistance at line c. It is now well above its slightly rising WMA. This A/D line does contain a number of bond issues and the stocks only A/D line has not yet made new highs.
The NYSE Composite is still 0.8% below its July high but is not far below the daily starc- band at 11,978. The upper boundary of the trading channel, line a, is now at 12,118. The close Friday was below the highs with the now rising 20 day EMA at 11,833.
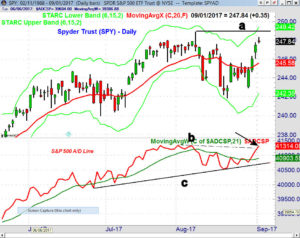

The Spyder Trust (SPY) formed a doji on Friday with the daily starc+ band at $249.42 and monthly pivot resistance at $250.32. The daily A/D line has moved above the key resistance at line b, and its WMA is now trying to turn higher. The weekly A/D line (not shown) did close at a new all-time high confirming the positive intermediate term trend.
The monthly pivot for SPY is at $246.08 with the rising 20 day EMA at $245.58. The monthly pivot support is well below the market at $243.24.
The iShares Russell 2000 (IWM) had an impressive rebound last week as it closed back above the $140 level and the quarterly pivot at $139.16. There is next resistance in the $141.50-$142 area. The weekly Russell 2000 A/D line has moved back above its WMA which is a good sign but the daily A/D is quite overextended.
The Economy
Even though Friday’s job report was a bit weaker than expected but overall the rest of the data was strong. The week started off with another positive report from the Dallas Fed Manufacturing Survey that was followed Tuesday by a better than expected report on Consumer Confidence.
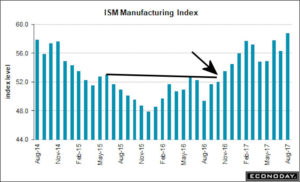

The preliminary reading on 2nd quarter GDP at 3% gave stocks a boost on Wednesday as it was above the consensus estimate. The Chicago PMI continues to reflect strong activity as did Friday ISM Manufacturing Index which came in at 58.8. The chart looks very strong as it completed a good bottom formation last November and a new multi-year high in August. As Econoday commented “new orders and backlog orders were unusually strong in July”. The month ending Consumer Sentiment was weaker than expected at 96.8 as the street was looking for 97.4.
After the long weekend we have Factory Orders on Tuesday with the ISM Non-Manufactory Index on Wednesday and it was lower than expected in July. There is also the PMI Services Index.
Interest Rates & Crude Oil
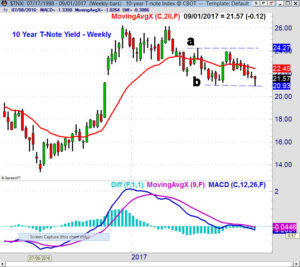

The yield on the 10 Year T-Note dropped slightly below the June low last week but then rallied to only close a bit lower for the week. This is an encouraging sign and is consistent with upward revision in GDP and the other positive economic data.
A weekly close above 2.217% this week would be positive but a close above 2.291% is likely needed to turn the momentum positive. The MACD is negative and would likely need a couple of weeks of positive closes before it could turn positive.
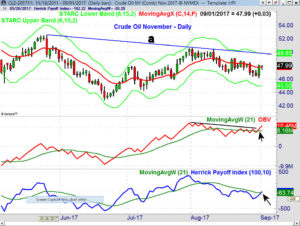

The November Crude oil contract had a low Thursday of $46.14 but then rallied and closed the week at $47.99. The concerns over the refinery outages and a number of new bearish forecasts for crude oil create an interesting situation. In the latest COT report there was a drop in long positions and a large increase in short positions.
The daily technical improved last week as the OBV moved above the resistance, line b, and its WMA. The HPI has been below its WMA and negative since early August. It turned positive on Friday and early strength this week will confirm this positive signal. There is monthly pivot support at $45.86 with trend line resistance in the $50 area, line a.
What to do? The end to the correction came sooner than expected but as the earlier examples demonstrate reducing the exposure to the long side of the stock market is a good idea when the A/D lines are in the corrective mode.
During the summer of 2015 there were a number of high profile market analysts who were not concerned about the stock market until the August plunge caused some to change their view. Those that were predicting a crash at the start of the summer missed the July rally and are likely still out of stocks.
Despite last week’s strong action I would not be chasing the long side of the market at current levels as I expect a better risk buying opportunity in the next two weeks. Investors who have been following my bullish outlook and dollar cost averaging strategy since the spring of 2016 should stay on the long side until there are weekly warnings of a correction.
There are number of sector ETFs that look very good as we have a number of new buy orders for Viper ETF traders . I am targeting new lower buy levels for these ETFs. There are also several sectors which continue to look weak as they did in July and they should be avoided.
Viper Hot Stock traders made the shift to the long side last week and most of the new signals after Friday’s close were on the buy side. Our new longs in Neflix (NFLX) and Micron Technology (MU) are working out well.
In my Viper ETF Report and the Viper Hot Stocks Report I provide market analysis twice a week along with specific advice. You will also learn about the markets for only $34.95 each per month.
Comments
comments