There were signs last Thursday from the open interest analysis that the short side of crude oil was too crowded and those on the short side were starting to get squeezed (Time To Squeeze The Short Oil Speculators?). The March crude oil contract was trading around $28.39 at 11:00 AM EDT Thursday as the market was just trying to digest another bearish report on supply.
Oil industry experts in Davos were also painting a gloomy outlook for crude oil prices. By the end of the day prices had firmed and crude skyrocketed Friday to close at $32.19. The strong action was supported by further evidence that those who were short crude oil were nervously covering their positions.
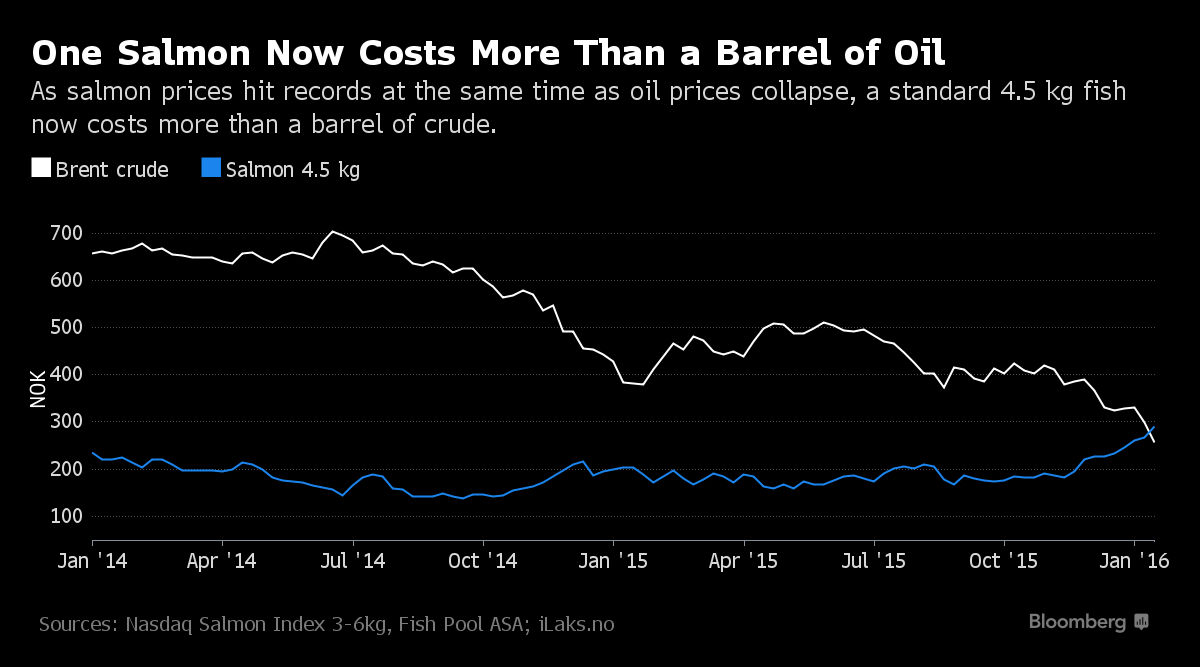
Crude oil dropped 7% to start off the week as the crude oil bears breathed a sigh of relief. A Bloomberg article on Tuesday pointed out that one salmon now cost more than a barrel of crude (see chart). This was followed by an article in Fortune about how many other items were also now more expensive that a barrel of crude.
By Wednesday's close the rally in crude oil had clearly resumed as the financial media attributed the rally to "a report on the potential for OPEC and other producers to cut output". The further gain of 5% early Thursday was supposedly due to a report from Russia’s Energy Minister that OPEC would meet to discuss cutting production. The market's enthusiasm was dampened by a subsequent comment from OPEC that they had no plans to cut production but what is the more important technical outlook?
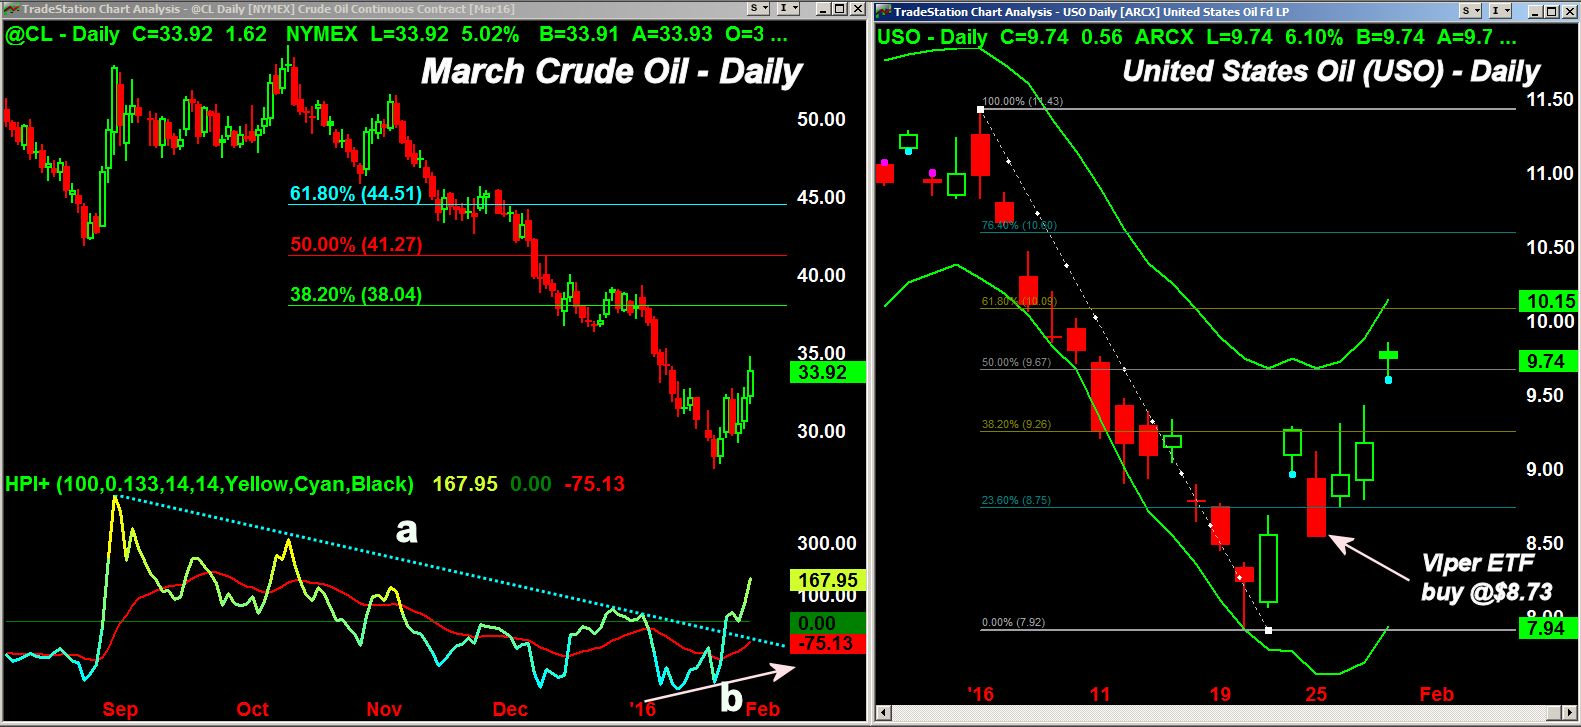
The daily chart of March crude oil shows that first resistance in the $35 area has been reached.
- There is additional resistance now at $36.30-$37 with the 38.2% Fibonacci retracement resistance at $38.04.
- Powerful rebounds in a downtrend (see my recent discussion on Bear Markets) will often terminate between the 38.2% and 50% resistance levels. A rally to the $40 level is therefore possible.
- The bullish divergence (line b) in the Herrick Payoff Index (HPI) last week supported my view that those on the short side were starting to cover and this favored higher prices.
- This view has been confirmed by the strong move in the HPI above its downtrend, line a, as money flow is well in positive territory.
- This is a sign that crude oil can still continue higher though there are likely to be sharp setbacks along the way.
The daily chart of the United states Oil Fund (USO) shows that the short term 50% retracement at $9.67 was reached early this morning.
- There is additional resistance in the $10 area with the daily starc+ band at $10.12.
- There is a band of resistance in the $10.80-$11.50 area.
- The pullback on Monday and early Tuesday took prices slightly below the weekly pivot at $8.83 and back into good chart support which was a good buying opportunity.
- The daily OBV and RS analysis on USO (not shown) are positive consistent with a further rally.
Though stocks have been choppy this week the rebound in the energy sector has been supportive as I suggested last week in Can Crude Oil Now Rescue Stocks?
The daily technical studies on energy sector ETFs like the SPDR Oil & Gas Exploration (XOP) are also now positive. XOP is up 23% from last week's low versus just a 4.3% gain in the Spyder Trust (SPY). The next upside target for XOP is in the $29.50-$30 area.
What's Next? This will not be a straight up move though day to day some margin calls are likely to cause additional sharp surges that may then be muted by bearish fundamental comments or data. There should be some additional good entry points on the long side though the pullback early this week (see Viper ETF Report) was likely the best in terms of risk/reward.
Comments
comments