

The stock market gave traders a good fake out Monday as the afternoon price reversal was a sign of weakness but the A/D numbers were 2-1 positive. As I pointed out (see Tues AM Tweet) the McClellan oscillator had also broken its downtrend which set a positive tone for Tuesday.
Another strong close on Wednesday will provide further evidence that the market is going to break out of its trading range and make convincing new rally highs. The daily starc+ band for the Spyder Trust (SPY) is at $208.93 with the monthly pivot resistance at $212.46. This should be enough to turn many of the skeptical analysts and neutral individual investors back into the bullish camp. This may help to dampen the recent bubble talk that I focused on last weekend.
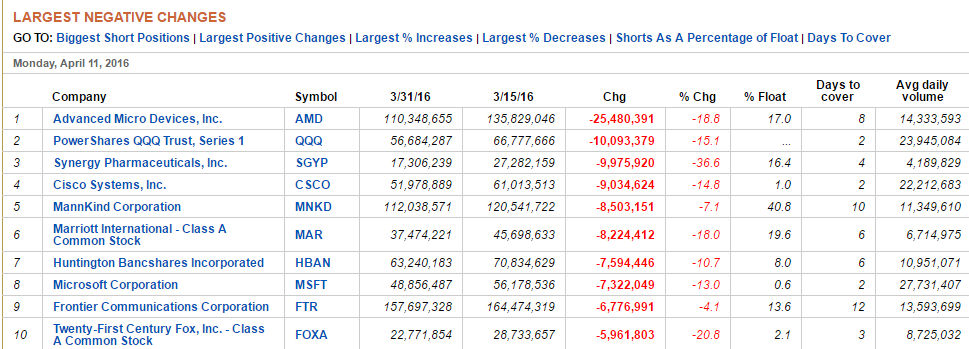
The recent short interest data that was released on April 11th reveals the latest data as of the end of March. This excerpt from the Wall Street Journal table is an example of their excellent coverage of the data. They break down the info into six categories: Largest Positive Changed. Largest Negative Changes, Largest % Increases, Largest % Decreases, Shorts As A Percentage of Float and Days to Cover.
The short interest data alone is never a reason to buy or sell a stock though short sellers should always look at this data before they short a stock. As part of my weekly scan process that I use to select stocks for Viper Hot Stocks look at the short interest data to see if it support a long recommendation. At the end of March I noticed the March 11.7% increase in the short interest of Seagate Technology (STX). This helped support the very bullish weekly OBV readings leading to the buy recommendation on April 4th.
In today's column I want to look at two stocks where there has been a large % decrease in the short interest. When you see this occurring in combination with positive technical readings it means the stock can move even higher.
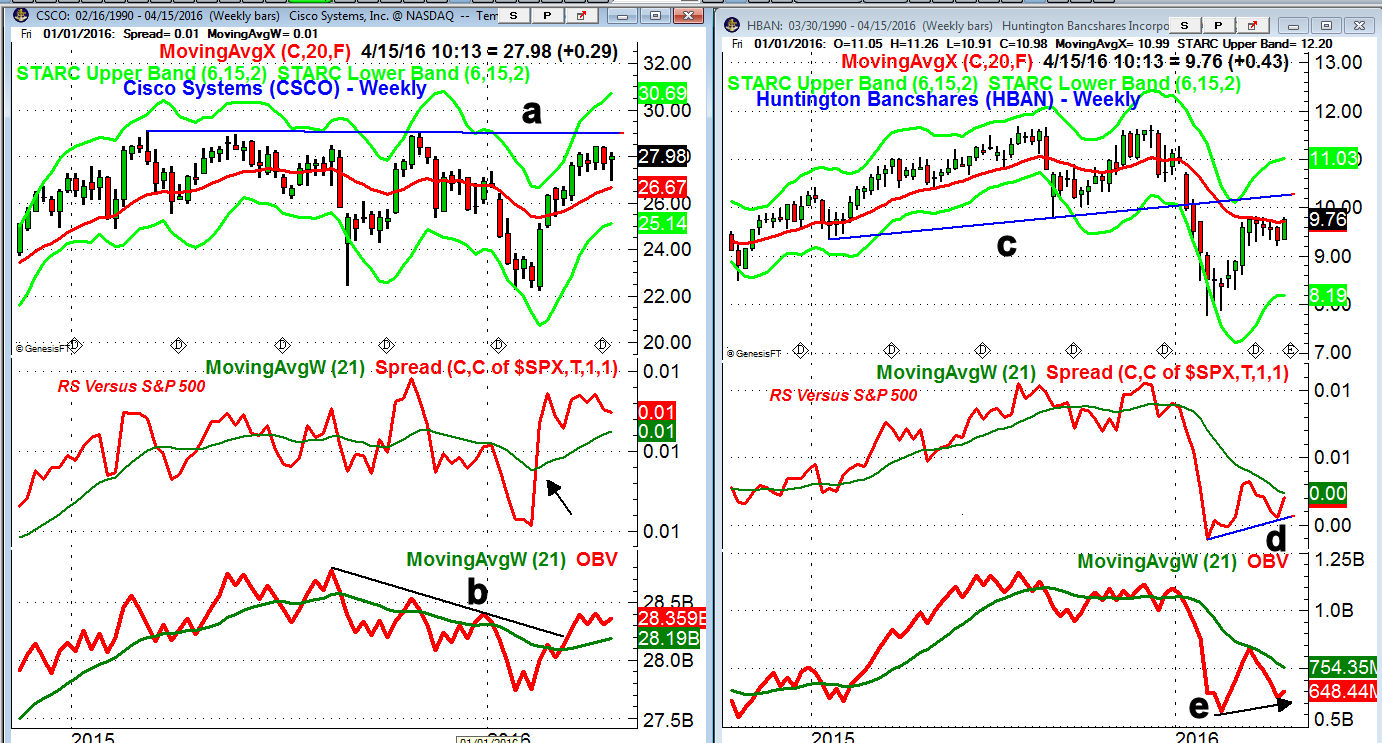
Cisco Systems (CSCO) is up 3.7% YTD as it is slightly outperforming the Spyder Trust (SPY). It does not report earnings until May 18th. The short interest rose from 43 million in mid- January to 62 million at the end of February. It is down 14.8% in the latest period.
- The weekly chart shows that there is major resistance, line a, in the $29 area.
- A breakout would be impressive with the quarterly pivot resistance at $30.62.
- The rising 20 week EMA is at $26.68 which represents good support.
- The weekly relative performance moved above its WMA on February 12th
- The RS line is still holding well above its rising WMA.
- The weekly OBV broke through its downtrend, line b, in early March and continues to look positive.
- The daily studies do not show any strong signs yet of topping out.
Huntington Bancshares (HBAN) is still down 12.8% YTD though it has rallied 25.8% from the late January lows of 47.77. The short interest rose from 37 million at the end of January to 63 million at the end of March but was down 10.7% in the latest period.
- HBAN is higher this week and is trying to close above the five week high at $9.82. It has been holding above the quarterly pivot at $9.39.
- There is longer term chart resistance in the $10.30, line c.
- The quarterly pivot resistance is at $10.95 with the weekly starc+ band at $11.03.
- There is weekly chart support at $9.22 with stronger at $8.80-$9.00
- The weekly RS line has formed higher lows, line d, but is still below its WMA.
- A similar formation in the weekly OBV but its WMA is still declining.
- The daily studies are positive and do favor a further rally.
What to do? If you are not familiar with the short interest I suggest you take a look at it when you are considering a new purchase. The Nasdaq also has good short interest data as it will give you a list of the data on a stock from each reporting period. The tight range on HBAN makes it look the most interesting especially if you can buy close to the quarterly pivot.
Editor's Note: The ability to read the volume patterns in a stock or ETFs can often make the difference between success and failure. Tom will be teaching a two part interactive online class at end of April to a very small number of students. For more information - here is the link for the Secrets of Volume course.
Comments
comments