

Editor's note: If you like Tom's analysis, check out ViperETF.com, his premium newsletter.
The stock market paused Wednesday as comments from Fed Chair Janet Yellen again raised the possibility of a December rate hike. Choppy action before the monthly jobs report is not uncommon and while the major averages are overbought there are no strong signs that the powerful rally from the October 2nd lows is over.
Though many stocks have disappointed this earnings seasons I am not surprised that overall earnings have not been as bad as most expected in September. In early October Factset was looking for a year-over-year earnings decline of 5.5% in the third quarter but now with "70% of the S&P 500 having reported results through Monday morning, the average blended estimate for earnings per share, which includes already-reported and estimates of yet-to-be-reported results, is a year-over-year decline of 2%."
The stellar earnings by several companies have caught many by surprise but they have some common technical features that investors should understand when monitoring their portfolio during earning's season. Both of the stocks I am discussing in today's column have clearly outperformed the Spyder Trust (SPY)
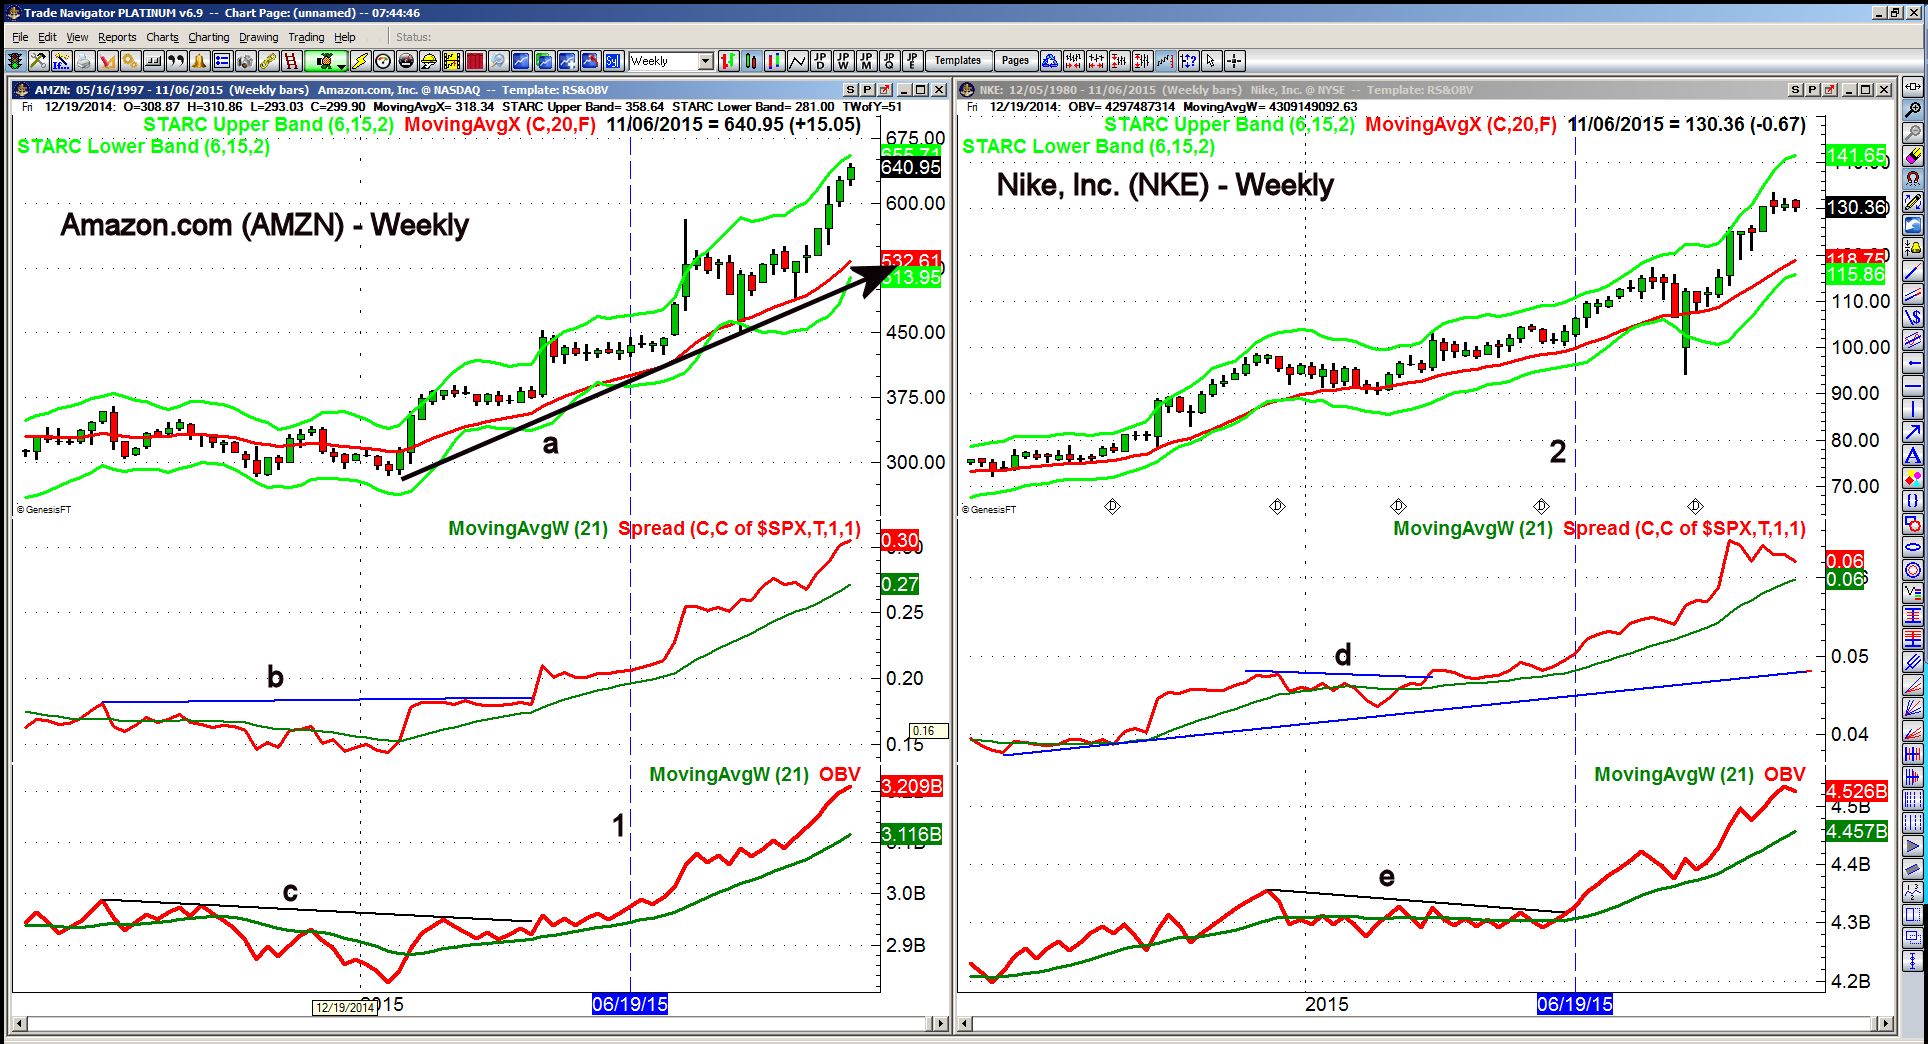
Amazon.com (AMZN) ” beat estimates with huge surge in cloud sales and profit" as the stock is up over 10% in the past month and over 100% YTD. In my analysis I always start with the weekly and monthly charts where the technical readings are the most important.
The weekly chart shows a strong uptrend from the 2014 lows as during the late August drop AMZN just pulled back to its 20 week EMA before closing the week higher. The quarterly pivot resistance at $661.01 and starc+ band at $655.74 are now not far above current levels.
The weekly relative performance (The Secret to Trading ETFs for Profit) broke through resistance from 2014, line b, in April as it was already above its rising WMA. By June the uptrend had gained even more strength as it has continued to make higher highs with the WMA rising strongly.
The OBV also moved through its resistance in April, line c. As price traded in a tight range of $414-444 in May and June the OBV was moving to a new high, line 1. This was a sign of strong accumulation. The OBV has continued to lead prices higher.
Nike, Inc. (NKE) surprised the market in September with strong sales from China and the stock is up almost 13% in the past three months. and 36.45% YTD. Even though the stock had a very sharp setback in late August the weekly technical studies held firm. The relative performance broke out to new highs in March as it overcame the resistance at line d, which was preceded by a move above its WMA. This identified NKE as a market leader.
The on-balance-volume (OBV) formed a downtrend, line e, for the first half of 2015 but then moved through this resistance on June 19th (line 2). The WMA of the OBV then started a strong uptrend and even during the August correction the OBV held above its WMA.
The weekly starc+ band is at $141.86 with the 4th quarter pivot resistance at $146.08 . Currently NKE is close to the 20 day EMA ($129.05)but is well above the 20 week EMA $118.70.
NKE has been moving sideways for the past two weeks as the overall market has rallied sharply. Therefore further consolidation is possible before the stock sees another sharp surge to the upside.
What to do? The use of the volume and the relative performance analysis can be a very useful tool to help you determine what do with a stock as it heads into its earnings report. Those stocks that miss on earnings often show a deterioration in both the weekly as well as the daily OBV and RS analysis as they head into earnings.
Of course during earning's season I do favor ETFs in strong sectors as they help one avoid an earnings shock from any one company.
Comments
comments