

Editor's note: If you like Tom's analysis and want specific entry/exit advice on ETFs check out Viper ETF Report his premium newsletter.
Instead of the correction I was looking for a week ago the market was hit with relentless selling for most of the week. For an already dropping market the news that junk bond fund Third Avenue Focused Credit Fund (TFCIX) had decided to stop redemptions triggered even more selling . The fund is down almost 27% year to date and because most of their bonds are illiquid holders are unlikely to get anything back soon.
So how long is the stock market selling likely to last?
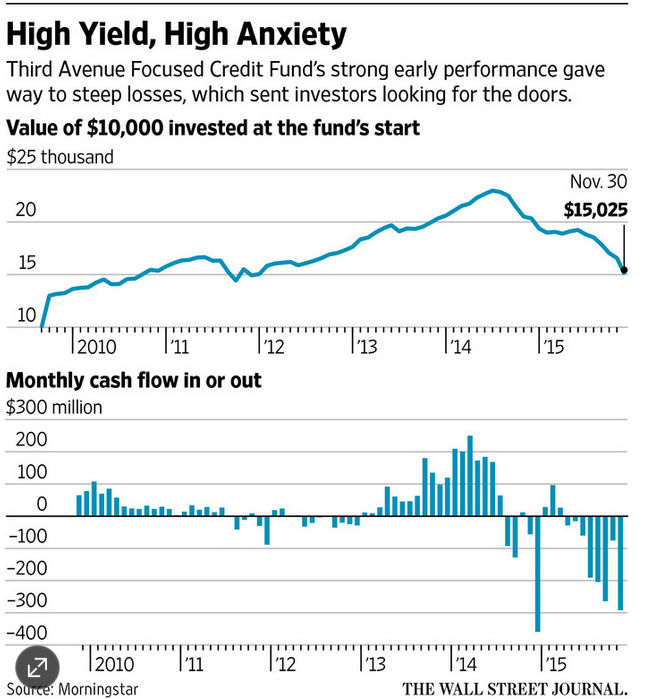
The chart from the WSJ shows that net redemptions started in the last half of 2014 and have accelerated over the past five months. Total assets peaked at around $3.5 billion in 2014 and are now under $800 million. Reports suggests another $3.8 billion was removed from junk bond funds and ETFs last week. After the long accumulation period more redemptions are likely.
I have been warning about the high -yield market for many years and in this August 2011 article "High-Yield Bets Bite Back" I commented that ” One of the first lessons income investors normally learn is that when one instrument has a much higher yield than others, it is a signal that the risk is also much higher."
I have warned about high yield instruments like Annaly Capital Management (NLY) for years as it completed a major top in 2012 (see chart). At the time I "pointed out that one of the other high-yield favorites Anworth Mortgage Asset (ANH) had just $8.8 million in cash with a debt of a $7.7 billion, but investors were still buying."
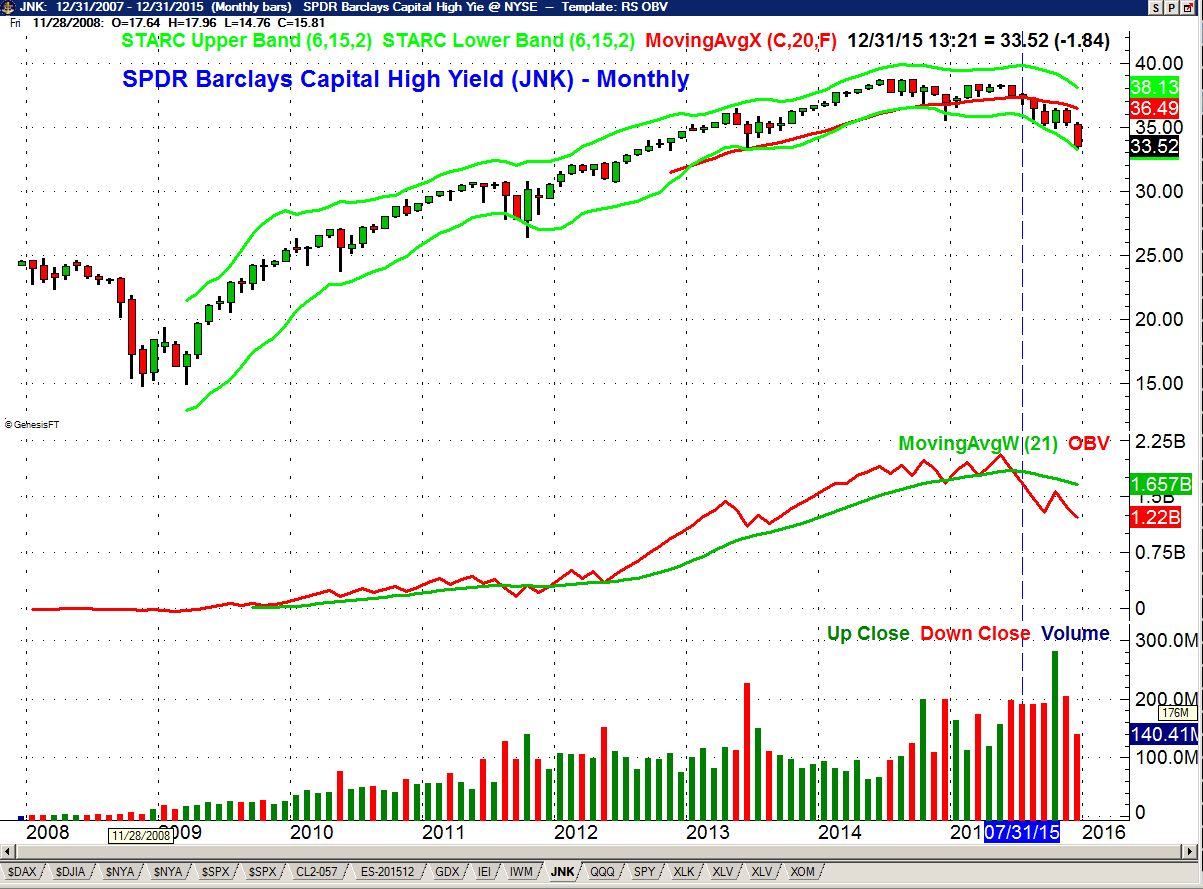
The high -yield ETFs like SPDR Barclays Capital High Yield (JNK) have also seen some heavy selling as the weekly OBV turned negative on July 31st (line 1). The volume has been heavy over the past seven weeks as JNK is down over 6% YTD which is just slightly less than its yield of 6.32%. A decline to teh $31 level would not be surprising.
The main questions is whether this is just the start of a bond market panic or just an isolated event. There is no way to really tell but I have long argued that many holders of bond funds do not realize that unlike holders of individual bonds they do have the risk of capital loss. Their year-end statements may provide a rude awakening. In my experience panic over an asset class often last longer than one might expect.
I would expect the current turmoil to continue for a couple of more weeks as it will take time or a very powerful stock market rebound to reverse the recent technical damage. Though December is typically a strong month for stocks that may not be the case this year.
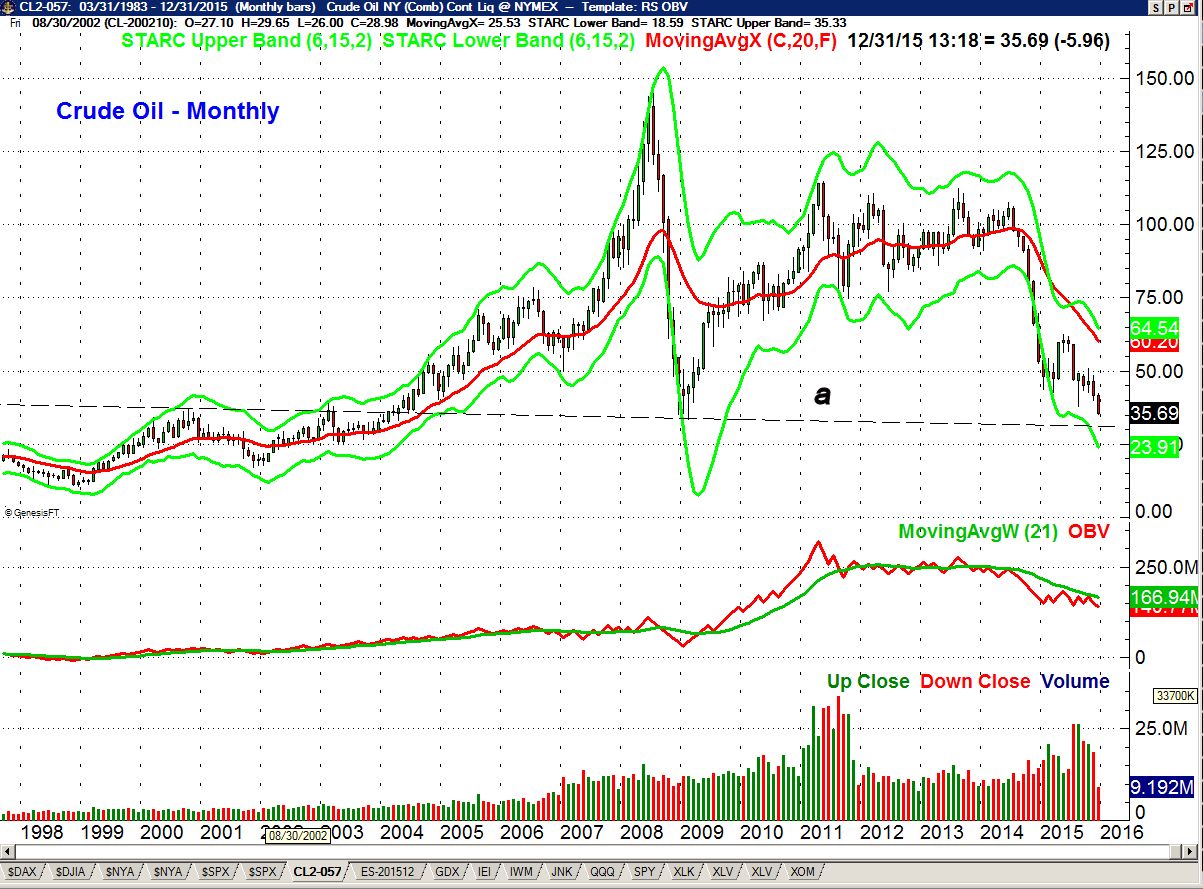
The pressure on the junk bond market is due in part to the continued plunge in crude oil prices though apparently Third Avenue Focused Credit Fund did not have major exposure in energy sector credit. The monthly chart of crude oil shows the February 2009 low was in the $33.50-$34 area. There is next long term support, line a, in the $30 area. The monthly starc- band for January is in the $24 area.
There are no signs yet of a bottom basis even the daily studies and while the sentiment on crude is very negative it is not as negative as it was in August when we saw an eight week bounce. There is daily chart resistance now in the $40-$42 area but a rally up to this level would have to be treated with skepticism. The open interest has surged in the past week signaling that new short positions have been established
If last week's market weakness was not enough to worry investors we have the FOMC meeting this week. Most expect the FOMC to raise rates at this meeting. Such a rate hike may trigger a stock market rally but more investors are concerned about the long term impact of rising rates.
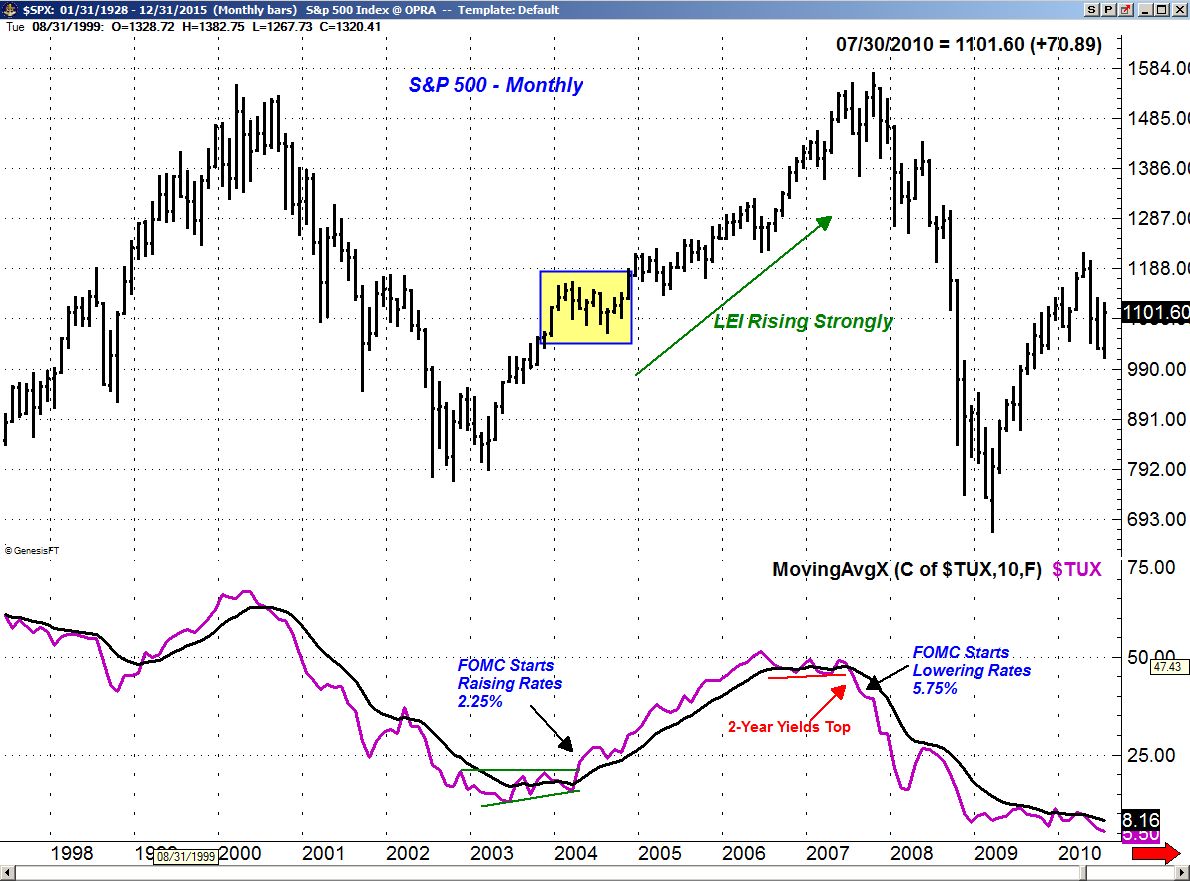
The FOMC raised the discount rate from 2.00% to 2.25% on June 30, 2004. This was two months after the yield on the 2-Year T-Note had bottomed. The S&P 500 consolidated from February to November before it completed its continuation pattern and turned higher. As I noted in November the Leading Economic Indicators (LEI) (see chart) was rising sharply in 2004 consistent with a healthy economy.
Last month's data on the LEI was positive and it shows no signs yet of topping out. It will typically tops out many months before the start of a new recession. Clearly I do not think that a gradual increase in rates by the FOMC will be a negative for the stock market in the first half of 2016.
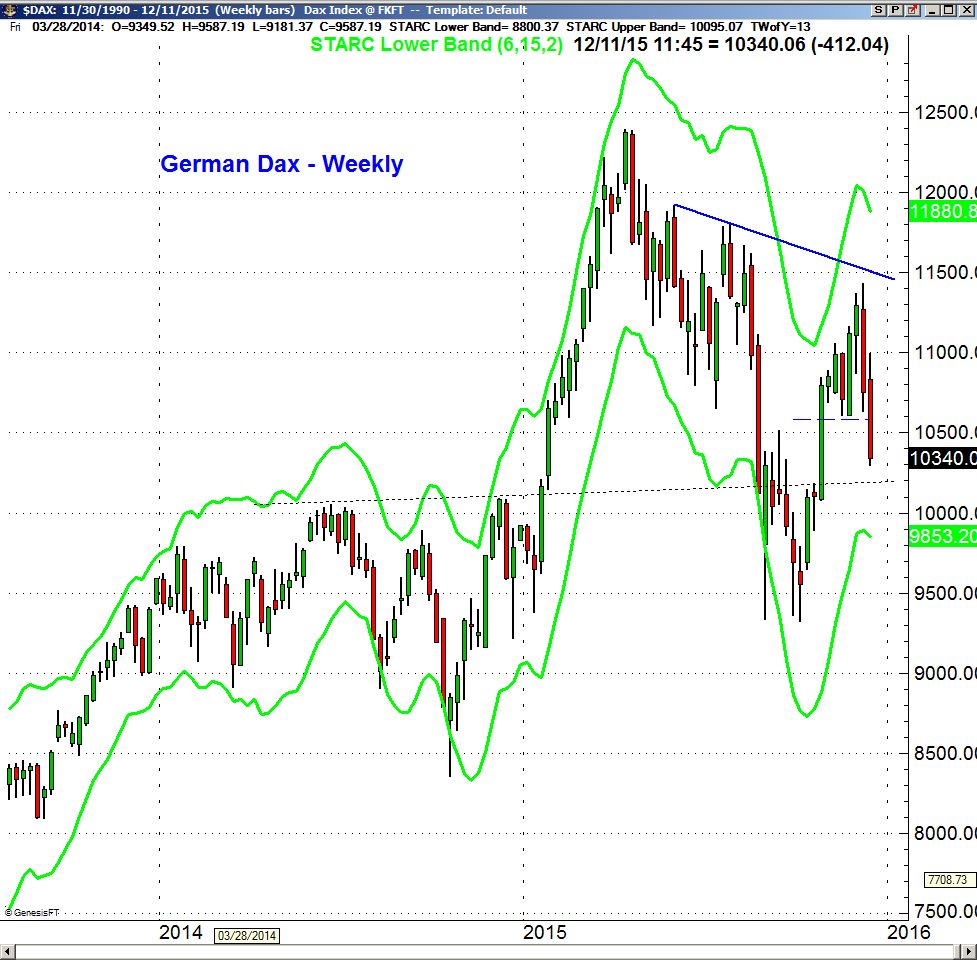
Last week I was concerned about a further decline in the overseas markets like the German Dax. It had a rough week as it lost 3.8% and has dropped well below the November lows at 10,600. There is further support at 10,000 with the weekly starc- band at 9853 which is 4.7% below last Friday's close. The Dax needs a close back above 11,500 to reassert the uptrend.
The Economy
There was little in the way of economic data last week as the NFIB small Business Optimism Index dropped 1.3 points in November. This is consistent with the recent decline in consumer confidence as survey participants are concerned over falling sales and earnings trends. On the plus side is the outlook for new hiring and capital investment.
On Friday overall Retail Sales rose just 0.2% but retail and food services improved nicely again as they have all year. Sales at clothing stores were up 0.8% while online sales were up 0.6%. Sales at sporting goods and hobby stores were up 0.8%. The increase in consumer spending improves the outlook for the Christmas shopping season.
The Producer Price Index also surprised economist as it advanced 0.3% IN November. Consumer Sentiment also improved to 91.8 up from November's final reading. The improving current conditions are a plus for the holiday season while expectations could be giving a cautionary note for 2016.
There is a full calendar this week starting Tuesday with the start of the FOMC meeting , Consumer Price Index and Housing Market Index. This is followed Wednesday by Housing Starts, Industrial Production, PMI Manufacturing Index and the FOMC announcement in the afternoon.
On Thursday we have the Philadelphia Fed Business Outlook Survey and the all important Leading Indicators. The Fed surveys on the Atlanta and Kansas City regions come on Friday.
Market Wrap
There was no late day rally on Friday with the major averages closing on the lows for the week and the day. The broad based selling took the S&P 500 down 3.8% while the Russell 2000 dropped just over 5%. The worst selling was in the Dow Transports which dropped 5.4% with only 386 stocks advancing and 2844 declining.
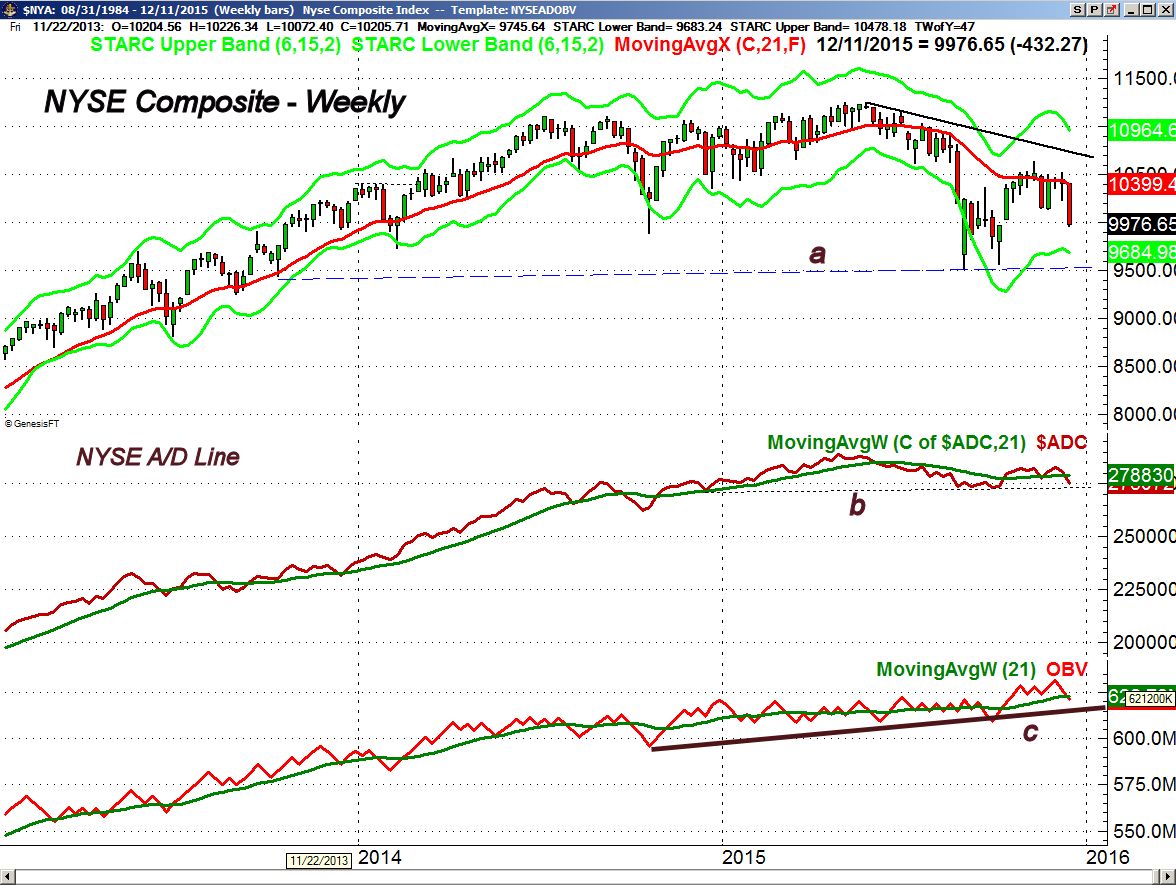
The NYSE Composite closed well below the November lows as it gapped lower on Friday. The weekly starc- band is at 9684 with support going back to late 2013 in the 9500 area, line a. A decisive close under this level would create a major area of supply for the NYSE in the 9900-10,500 area. The declining 20 day EMA is now at 10,304 and the NYSE closed on its daily starc- band. The relatively large bond fund issues in the NYSE have hurt it more than the S&P 500.
The weekly A/D line has dropped below its WMA and is still above the major support at line b. The daily A/D line (not shown) is now in a short term downtrend but is still above the bullish divergence support from the October lows. The McClellan oscillator closed at -257 and is in solidly oversold territory. The ARMs index closed at 1.67 which is oversold but well below the extreme of 4.97 seen on September 1st.
The weekly OBV made a new high just a few weeks ago but has now dropped back below its WMA with key support at line c.
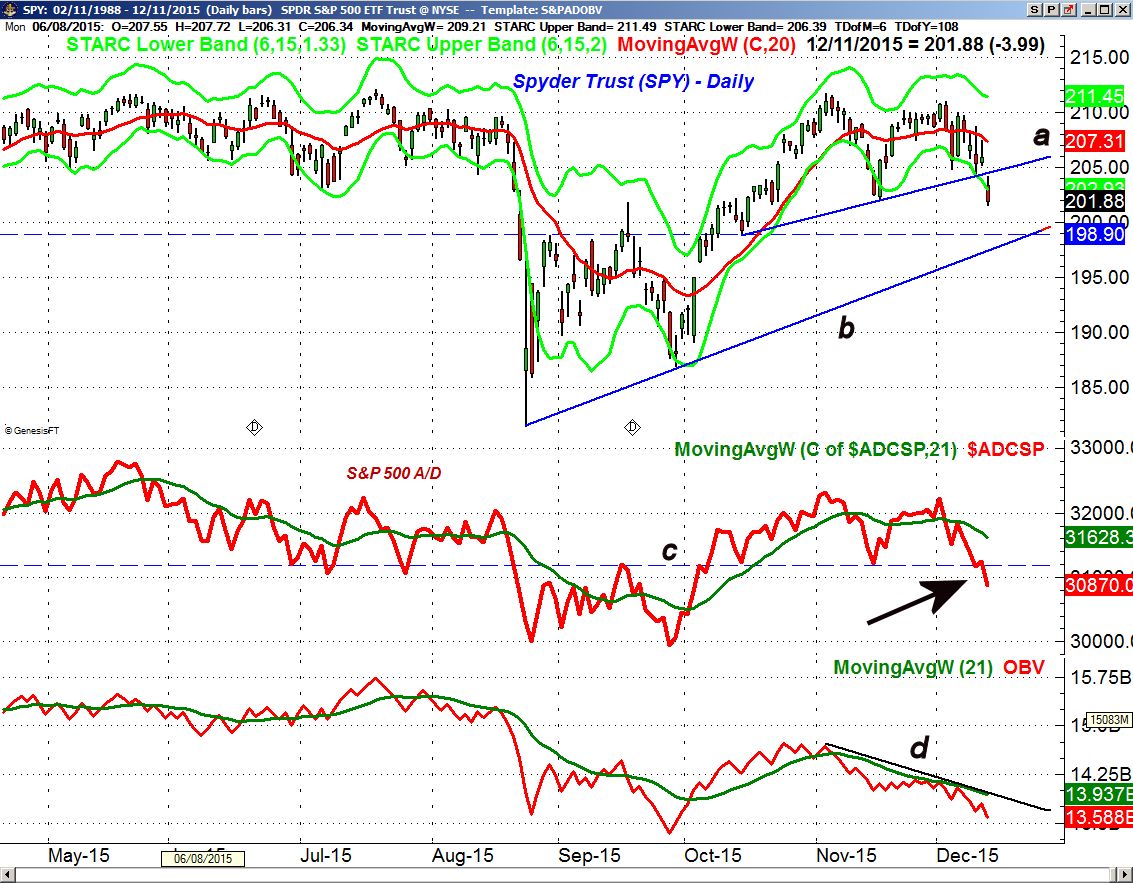
The Spyder Trust (SPY) gapped below the daily chart support, line a, on Friday closing well below the starc- band. There is converging support now in the $198 area, line c, with the quarterly pivot at $195.06. The longer term support still stands in the $188-$190 area.
The daily S&P A/D with Friday's close is now in a short term downtrend as the support at line c, was violated. The gap between the A/D line in its WMA is quite wide consistent with its short term oversold status. The daily OBV has dropped further below its WMA and was appropriately negative at the start of last week.
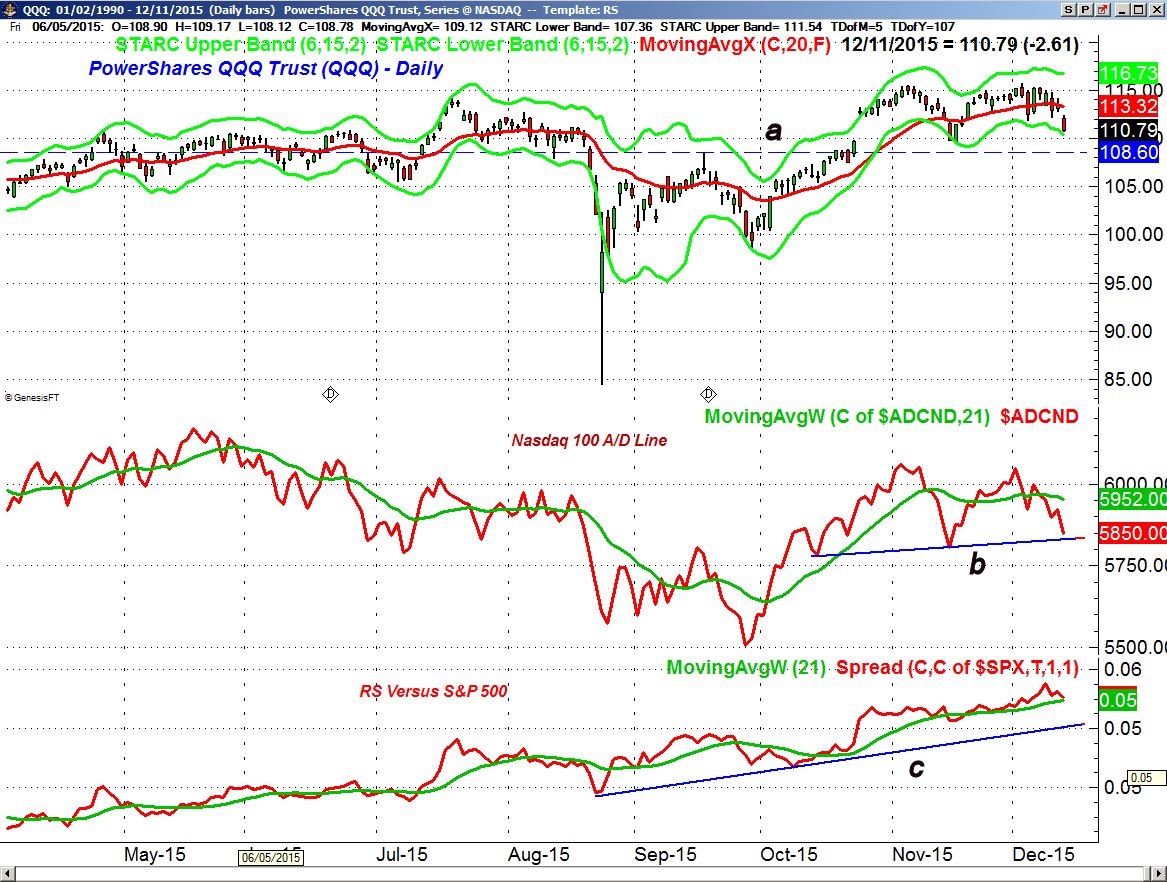
The selling spread to the tech sector on Friday as the PowerShares QQQ Trust (QQQ) closed on the daily starc- band. The next good support is in the $108.60 area, line a, with the weekly starc- band at $105.43. The daily Nasdaq 100 A/D line dropped sharply Friday but is still above the support at line b.
The daily relative performance made a new high last week indicating that the QQQ was still outperforming the S&P 500. The RS line turned lower on Friday but is still well above the support at line c. The weekly RS analysis (not shown) is also still in a strong uptrend.
The iShares Russell 2000 (IWM) closed back below the $112 level with next good support now in the $108-$110 area as the early signs of the January effect have been negated.
What to do?
Clearly I was too positive on the market in last week's column as I was looking for a pullback of a couple of days not a week long plunge. Though I carefully manage the risk on my positions and those of my clients it was one of the worst trading week's I have had in many years. Fortunately it did not erase our nice gains from the October rally.
Given the plunge in stock prices I am surprised that the bearish sentiment is not even higher. The bullish% according to AAII just dropped 1% to 28.5% with the bearish % at 29.2%. The CNN Fear & Greed Index has dropped further into Fear territory as it is now at 24 below the fear reading of 37 from a year ago.
Surprisingly there have not been as many "new bear market articles" like there were in September. The Saturday NY Times headline "Wall Street Slips on Oil's Big Drop" seemed to downplay last week's action. I hope be happier if there was a larger gloom and doom contingent.
The daily studies are now firmly back in the correction mode even though there were some characteristic signs of panic selling late last week. The FOMC is expected to raise rates this Wednesday and many think they will dampen expectations for further rate hikes. This may help calm a nervous stock market.
On a short term basis any rally will have to be watched closely as it needs to be much stronger than last week's bounce to suggest that the market has stabilized. Otherwise a 1-2 day bound is likely to fail.
For investors there are no signs of a recession in fact the economy seems to be getting a bit stronger. This makes a new bear market unlikely at this time. Therefore I continue to favor a dollar cost averaging plan for new investors in a low cost ETFs or mutual fund. Those who bought on weakness as I recommended last week may have picked a good entry point.
Traders will need to be nimble new week and I would not chase the short side with the major averages at their daily starc- bands.
Last week I posted a video introduction to my unique method of relative performance analysis hope you enjoy it https://youtu.be/j3xX25KJ0NU
Editor's note: If you like Tom's analysis and want specific entry/exit advice on ETFs check out Viper ETF Report his premium newsletter.
Comments
comments