

The stock market was surprised by the FOMC decision to only raise rates two more times this year as stocks soared in reaction to the announcement even though Wednesday's rate hike was widely expected. The higher weekly close this week does support the view that the correction is over.
It seems that more are becoming skeptical about the market which is due in part to the fact that the Trump agenda seems to be hitting more and more speed bumps. The stock market's latest upward surge has confounded many who have been nervous about jumping into what many feel is an overheated market.
I can appreciate their dilemma as for successful investing or trading the focus has to be on the risk not the reward. This means that one must pay careful attention to determining their entry point and to be sure that you have a clear-cut price point where you will admit your mistake and get out.
One of my favorite technical studies that has helped me avoid buying too high or selling too low are the starc bands developed by the late Manning Stoller. Despite what you may read in some erroneous internet posts these are not used in the same manner as either Bollinger Bands or Keltner channels.
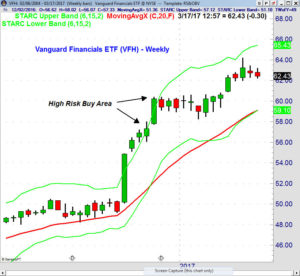

When prices are near the upper bands it is a hig risk level to buy and a low risk area to sell. One of the reasons I advised Viper ETF investors to sell their positions in the Vanguard Financial ETF (VFH) in the first part of December was because it had traded above the weekly starc+ band for four consecutive weeks.
The long positions had been established in late October before the election and investors had open profits of over 16% in just six weeks. This was near the five-year total return of 16.1% for VFH according to Morningstar. This was another reason to conclude that further gains could be limited until the market digested its gains.
In my column from October 31, 2015 Don't Make This Investing Mistake I expressed my astonishment at how mutual fund giant Sequoia (SEQUX) and Bill Ackman's Pershing Square Capital had held on to their massive positions in Valeant (VRX).
As I noted at the time "I was surprised to learn that VRX makes up 28.7% of SEQUX". I have always emphasized that any mutual fund or ETF should be investigated before it is bought and commented that " If you are working with an advisor who recommends a fund, ask them if they have closely looked at the fund's holdings". Missing the lack of diversity in SEQUX was inexcusable for any advisor in my opinion as was its then five star rating from Morningstar.

This chart is from the October 2015 article as both SEQUX and VRX had reached the weekly starc+ bands at the late July 2015 highs. In my technical review I pointed out that based on my relative performance and OBV analysis both had topped out by the end of September 2015 when SEQUX was trading at $245 and VRX was at $199.47.
By the end of October 2015 VRX had dropped to a low of $90.46. Those who follow the basic rules of Fibonacci retracement analysis know that if the 38.2% retracement support is broken then a decline to the 50% level is now likely. If this level is also broken then the focus is on the 61.8% level which if broken means the major trend has changed.
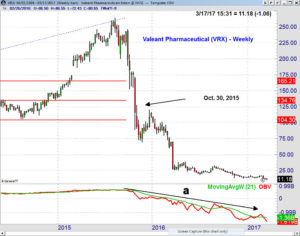

The major 61.8% support, derived from the VRX's October 2008 low at $5.70 and the 2015 high of $263.81 was at $104.30 which was broken in October 2015. The close below the 61.8% support was an objective reason to sell long positions in VRX.
After plunging further to a low near $79 in November VRX had a 70% rally late in the year as it hit $119.87 before the decline resumed. The weekly OBV has stayed in a well-defined downtrend, line a, since it broke support in 2015.
As we now know Bill Ackman still did not sell as he apparently kept buying and believing his 2015 hype that "Valeant could be the next Berkshire Hathaway". The Benzinga timeline reported that he sold his 27.2 million shares at around $11 each.
This the biggest hairball that any hedge fund has ever coughed up. Ackman's Pershing Square Capital Management purchased Valeant at an average cost of $196 a share in 2015, according to the hedge fund's 2016 letter. In March 2015 VRX amounted to 25% of the firm's portfolio
This is an extreme example of what a lack of a predetermined exit strategy can do to one's portfolio as know that risking 94% of your investment in any one stock is a prescription for disaster. For clients of my Viper ETF Report and Viper Hot Stocks Report I normally do not risk more than 5% so that the damage to the portfolio from any one position is limited.
As I discussed in a recent trading lesson "How To Place Your Stops" my stops are chosen very carefully to be under the level where many other stops are likely to be placed. Once a position moves in my favor the stops are then raised to further reduce the portfolio's exposure. Partial profits are generally taken at my initial price targets.
The bottom line is that you should determine your stop before you buy and then compare it with your proposed entry level to determine you risk. A risk of double-digit loss should be avoided at all times as if not you will soon be out of funds to invest should you encounter a losing streak.
This is especially important for new investors and many of the ETFs I like are well above good support which makes the risk too high on new investments. There are still a number of stocks that have a better risk profile currently.
The Economy
It was another week of data that supports continued improvement in the economy. Still there are some like a CNBC guest on their post FOMC show who commented that nothing has really changed for the economy in past year. That is an incredulous statement that a very good economist, Diane Swonk, quickly refuted.
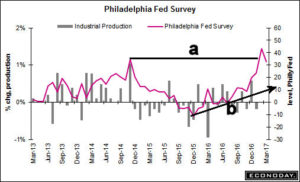

These ill-informed analysts do play a valuable role as they often help to dampen the bullish sentiment. Just a look at one data series, the Philadelphia Fed Survey, reveals that it did not start turning around until March of 2016 as the new uptrend was not confirmed until June (line b). It broke through resistance, line a, last month and last Thursday's report it again beat the consensus view.
Last week's PPI came in higher than expected at 0.3% while the CPI was expected at 0.1%. The Empire State Manufacturing Survey on Wednesday came in a 16.4 which was consistent with the strong Philly Fed reading.
On Friday, Consumer Sentiment came in at 97.6 which was what was expected while the all important Leading Economic Indicators rose 0.6% as the strong growth rate of the past three months has continued. It shows no signs of a recession on the horizon.
This week we have the Chicago Fed National Activity Index on Monday followed by the Existing Home Sales on Wednesday. Also out this week are New Home Sales on Thursday with Durable Goods and the flash PMI Composite on Friday.
Interest Rates & Commodities
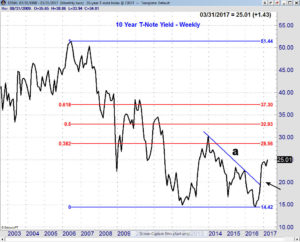

Even though the FOMC voted to raise rates last week the yield on the 10 Year T-Note declined last week The long term chart shows the decline from the 2006 high at 5.144% to the 2016 closing low at 1.442%. The three year downtrend, line a, was overcome in November and a higher close this month will keep the higher trend intact.
The major 38.2% Fibonacci resistance is at 2.856% and a close above this level will signal a move to the 50% resistance at 3.293%. It would take a monthly close in yields below 2.358% to call the uptrend into question. On a short-term basis the completion of the flag formation also favors higher yields so last week's pullback should not last long.
Gold prices rebounded last week to close up over $28 per ounce. This has reversed some of the daily negative signals that were generated on March 2nd and were discussed last week. This rebound creates and interesting situation for the week ahead.
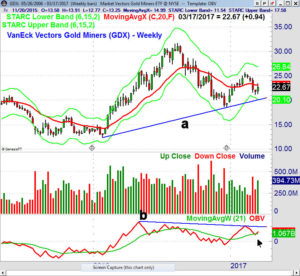
The VanEck Gold Miners (GDX) closed higher last week and back above the quarterly pivot at $22.02. The correction low at $21.14 was well above the weekly support at line a. The resistance at $25.33-$25.71 needs to be overcome to signal a move back to the 2016 high at $31.70. The volume was strong last week and the OBV has turned up from its WMA. A move in the OBV above the resistance at line b, would be very bullish.
Market Wrap
The rally on Wednesday was enough to push the Dow Industrials barely higher for the week while the S&P 500 was up 0.24% and the small cap Russell 2000 led the market as it was up 1.92%. The Dow Transports did not act well losing 1.55% while the Dow Utilities were up close to 1%. The weekly A/D numbers were strong with 2243 issues advancing and just 868 declining.
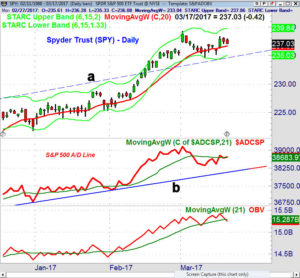

The Spyder Trust (SPY) was up 0.90% Wednesday but settled back late in the week to close just above the rising 20 day EMA at $236.65. The daily starc- band is at $235.03 along with the former resistance (line a) with the monthly pivot support at $233.53. The daily starc+ band is at $239.84 with the monthly pivot resistance at $244.02.
The daily S&P 500 A/D line closed barely above its WMA as it popped on Wednesday. As long as the March 9th lows in the A/D line hold it is likely that the correction from the early March highs is over. The weekly S&P 500 A/D line is holding well above its WMA which is positive for the intermediate term trend. The daily OBV did close Friday below its WMA but still shows a pattern of higher highs and higher lows.
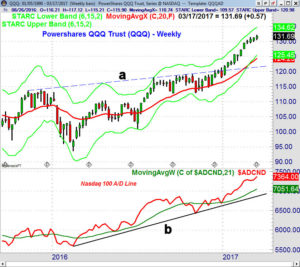

The PowerShares QQQ Trust (QQQ) made another new highs last week as it was up 0.4%. The monthly pivot resistance is at $134.37 with the weekly starc+ band now at $134.62. The close was above the rising 20-day EMA now at $130.28 with the daily starc- band at $129.84. There is more important support at $128.53 and the monthly pivot.
The weekly Nasdaq 100 A/D line also made a new high last week as it has turned up over the past two weeks. The daily A/D line made a new high on Wednesday as it broke out to the upside and it continued higher for the rest of the week.
Even though the iShares Russell 2000 (IWM) made strong gains last week the weekly A/D line is still below its WMA. The daily A/D line is back above its WMA but is still below the major resistance that needs to be overcome to confirm the correction is over.
What to do? The fact that all the daily A/D lines are above their WMAs does suggest that the correction is over. Further gains this week are needed to confirm a move to significant new highs in the S&P 500. A sharply lower close on widely negative A/D numbers however would be enough to signal a deeper correction before the market moves higher.
According to AAII the bullish% of individual investors is still quite low as it rose 1.2% last week to 31.2% while the bearish% declined 7.8% to 38.7% as these negative investors moved to the neutral camp. These levels are still more consistent with the end of the correction not the start of a further decline but sentiment always needs to be confirmed by the technical indicators.
The recent correction was an opportunity for those who were not invested to do some light buying in a low cost broadly diversified ETF. If we do get a deeper correction then it should also be a time to do some more light buying. I would wait for a full fledged correction to do more aggressive buying.
For Viper ETF subscribers new positions have been established in global ETFs and my in-depth analysis of the overseas ETF has identified new opportunities in the week ahead. For the US markets I am now using tighter stops and will look to take more trading profits if my upside targets are reached.
The Viper Hot Stocks Report traders are holding multiple long positions and most outperformed the S&P 500 last week.
Both the 4-5 page ETF and Stock reports are sent out twice a week and each report is only $34.95 each per month. New subscribers also receive the five most recent Trading Lessons and subscriptions can be cancelled on line at any time.
Comments
comments