
It was a choppy week for the stock market as it failed to follow through on the upside after the prior week's strong gains. Last week the market did a good job of confusing both professional and individual investors.
Stocks pulled back for the first two days of the week which was just a normal pullback so the early strength on Wednesday suggested that we could get a strong enough close to signal that the correction from the March 1st high was over. The lower close was another good example of why one should wait for the close before drawing any conclusions.
The market had shown some deterioration on Wednesday prior to the release of the FOMC minutes when the sellers took over. The dose of reality from Speaker Ryan on the prospects for a passage of a tax reform package likely caused a few more to sell. The market internals reversed completely from 2-1 positive to 2-1 negative by the close.
Instead of dropping more on Thursday the major averages did close mostly higher and the A/D ratio at 3-1 positive was much better than prices. The market continues to jerk short-term traders around on Friday as it dropped on news of the cruise missile attack on Syria and the poor jobs report but was then higher by the NY open.
The five-week decline from the March 1st high has only dropped the Spyder Trust (SPY) 2.2% but it certainly has had an impact on the sentiment. In their latest Survey AAII reported that bullish % dropped 1.9% to 28.3% while the bearish % rose 2.2% to 39.6%. The bullish % is at the lowest level since the November 3rd reading of 23.64%.
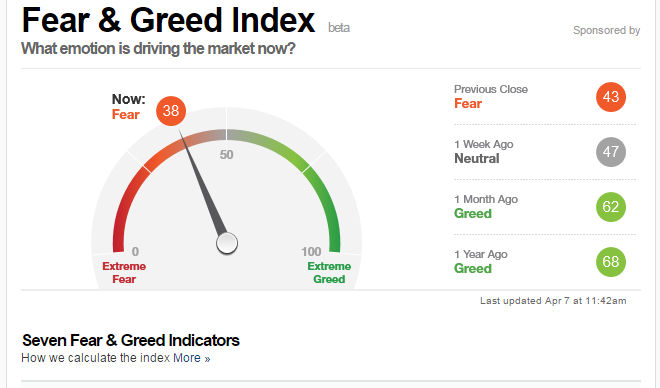
The CNN Fear & Greed Index which in my opinion is part a sentiment and part a momentum indicator now stands in fear territory at 39. It was neutral at 47 a week ago and 62 a month ago. A year ago it was 68 which is also in greed territory.
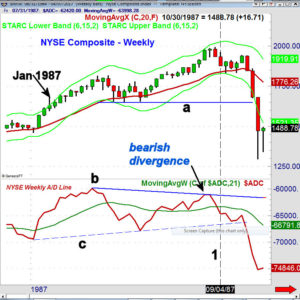

Much has been made of the fact that investors intelligence bulls rose to 63.1% on March 1st. This was the highest reading since January 1987 which has some thinking about the 1987 crash. The weekly chart of the NYSE Composite from 1987 shows that it rose another 10% after the peak bull reading before it corrected back to support at line a.
The NYSE A/D line peaked a few weeks before prices and then dropped below its WMA two weeks after the high. The A/D line made a new high in March but on the next rally which peaked in August, the A/D line made a lower high, line b. The fact that the divergence developed over 22 weeks was a strong market warning .
On September 4, 1987 the A/D line dropped back below its WMA (line 1). The major support at line c was violated the week of October 9th which confirmed the divergence. Stocks plunged over the next two weeks. In my experience it is not uncommon for sentiment to top or bottom well ahead of prices. Therefore i would not be concerned about a high bullish reading until there are signs of a significant top.
Of course the sentiment was much more bearish over a year ago when my weekend column was headlined Should Investors Ignore "The Wall of Worry? though some of the same sentiment still exist. As I pointed out "The markets are nervously waiting for the start of earnings season this week and by all accounts neither the investment pros nor individual investors are excited about the stock market." This still seems to be the case.
Despite the dramatic improvement in much of the economic data that I have noted since last fall many of the skeptics are focused on the relatively weak GDP data. Also on the bears worry list are the very high valuations, soaring margin debt and the concerns over implementing Trump's economic policies.
I do not think most investors are naive enough to think that Trump will able to fulfill his promises quickly but I think tax reform should be easier than health care as the Republicans will not be able to stand further embarrassment.
A year ago there were also concerns about China and crude oil but this year these fears have dissipated. As was the case last year many are still concerned about whether earnings will be high enough to justify the stock prices. Last June I had been expecting earnings to reverse their five-quarter negative trend.
For the 1st quarter Fact Set is expecting S&P 500 earnings to grow by 9.1% which would be the best since late 2011. Surprisingly the forecast was even higher at year-end when the growth was expected to be 12.5%. The focus this Thursday in part will be on Citigroup (C) and JPMorgan Chase (JPM)
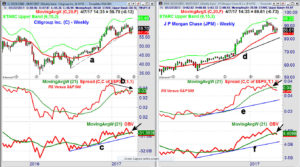

The weekly chart of Citigroup (C) shoes that it made a new high in early March before correcting as the weekly support, line a, was broken three weeks ago. There is important support at $55 which if broken could signal a move to the $50-$52 area. The weekly relative performance did not make a new high with prices in March, line b. A drop to new lows for the year will confirm the divergence. The weekly OBV is slightly below its EMA but above support at line c.
JP Morgan Chase (JPM) does look better technically than Citigroup (C) as it has dropped to its 20 week EMA but has not formed any divergences. There is initial support at $82.50 with chart support, line d, in the $80 area. The weekly RS has dropped below its WMA but did make a new high with prices. The OBV is testing its WMA so a high volume decline could push it well into negative territory.
Investors should continue to look at declines caused by negative headlines or concerns about a major market top as a buying opportunity until there is evidence of a recession or bear market.
The Economy
ADP Employment Report was very strong and made many disappointed by the low number in the monthly jobs report. I have always stressed that investors not pay much attention to any single report so the March increase of 98,000 I think is a weather related aberration.
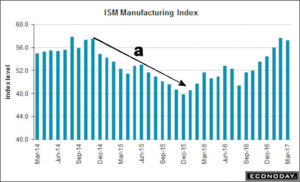

Manufacturing still seems to be on solid footing as the ISM Manufacturing Index came in at 57.2. It broke its downtrend, line a, in March 2016 suggesting the trend had changed. It would have to drop below 52 to weaken the trend. Factory Orders last Tuesday met expectations and show a good trend.
The ISM Non-Manufacturing report at 55.2 was weaker than the consensus estimate at 57. As Econoday commented "Slowing in employment is a warning signal in the March ISM non-manufacturing report ". Before I get too worried I will wait for a couple of additional data points.
This week the calendar is light with Import and Export prices on Wednesday followed by the PPI and Consumer Sentiment on Thursday. The stock market is closed on Friday but we still get the Consumer Price Index, Retail Sales and Business Inventories.
Interest Rates & Commodities
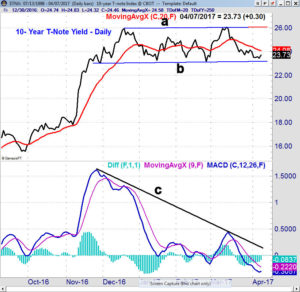

It was a wild week for the bond market as the 10 Year T-Note yield had a high of 2.391% and a low of 2.271% in reaction to the week jobs report and the overnight missile attack. The trading range that goes back to last November, lines a and b, is still intact as the lower boundaries were tested last week. The daily MACD is still in a solid downtrend, line c, but is trying to turn higher. A positive signal from the MACD needs to be confirmed by a break in the downtrend.
Crude oil bounced last week from the weekly support and closed up 3.2% for the week. There is next resistance at $53-$54 and a close above $55.24 is needed for a major upside breakout.
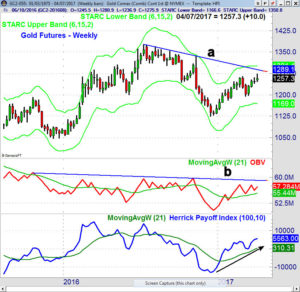
Gold futures popped overnight Thursday but then closed Friday well below the highs but still up for the week. The weekly downtrend, line a, is at $1289 with the weekly starc+ band at $1301. The weekly OBV is still above its slightly rising WMA but a move above resistance at line b, is needed to signal a rally to the 2016 high. The weekly HPI is at +5563 indicating that the money flow is positive.
Market Wrap
The Dow Utilities was the only major average to close the week higher while the Dow Industrials and Dow Transports were down 0.03% and 0.13% respectively. The small cap Russell 2000 was hit the hardest as it lost 1.54% after gaining 2.31% the previous week. The S&P 500 was down 0.30% as 1608 stocks rose and just 1478 declined.
Oil and gas stocks rose 0.46% last week and led the sector report as health care was down 0.05% and industrials lost 0.25%. Telecommunication stocks were the weakest down 1.16% followed by a 0.63 loss in the financial stocks.
Last week's action did not improve the technical outlook as a strong weekly close was needed to signal that the correction from the March 1st high was over. The weekly NYSE A/D line made a new high last week and is still well above its WMA. The Nasdaq 100 A/D line has made a series of higher highs in 2017 while the S&P 500 A/D line is now close to dropping below its WMA while the weekly Russell 2000 is still the weakest.
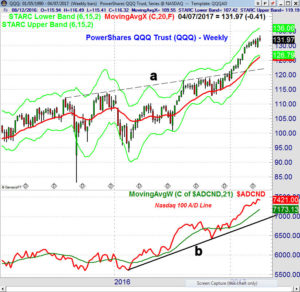
The PowerShares QQQ Trust (QQQ) made another new high last week despite last Monday's drop. The important short-term support on the weekly chart is now in the $129.00-$129.40 area. The 2nd quarter pivot is at $128.00 with the rising 20 week EMA at $126.18.
The weekly A/D line turned down slightly last week but continues to look very strong as it is well above its rising WMA. The long-term uptrend, line b, is much lower. The daily Nasdaq 100 A/D line (not shown) dropped down to its WMA on Wednesday but then bounced.
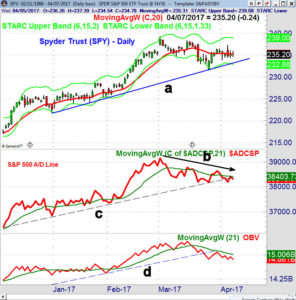

The Spyder Trust (SPY) dropped to a low of $233.91 Monday and then had a high of $237.39 early Wednesday but closed the week at $235.20 right on its flat 20 day EMA. The quarterly pivot is at $233.31 and a close this Thursday below this level will be a sign of weakness. There is also support from the January low, line b, and the daily starc- band in the $232.88-233.34 area.
The daily S&P 500 A/D line it still in a clear downtrend, line b. as it turned down from its WMA late last week. The further A/D line support at line c, was broken on Monday. The A/D line has more important support at the January highs. The weekly A/D line (not shown) is still holding above its WMA. The daily OBV broke its uptrend on March 24th and it is still below its WMA. The weekly OBV is positive.
The iShares Russell 2000 (IWM) bounced from the 20 week EMA at $134.14 as the low Thursday was $133.83 but it closed at $135.52 which was lower for the week. There is still important weekly support at $130 and the major breakout support at $126.
The weekly Russell A/D line closed above its WMA on March 31st but dropped back below it last week. The daily A/D line is actually in a short term uptrend but a drop below last week's lows will invalidate the uptrend.
What to do? Last week's analysis of the daily chart favored pullback early in the week that could set the stage for a strong rally and possibly a higher weekly close. This scenario was working out well until the FOMC minutes were released and stocks reversed to the downside.
As I hope is clear from the Market Wrap section the stock market needs a couple of consecutive strong days, especially in the S&P 500, to signal that the correction is over. The tech heavy QQQ still looks strong while the small cap IWM needs to hold last week's lows to avoid a stronger sell signal.
Those who were under invested and did some more light buying early last week should wait for a deeper correction or confirmation of a bottom before during more buying. There are a number of sector ETFs like technology and consumer discretionary that look good. Viper ETF clients are also long emerging and overseas markets.
Last week's action has generated many more sells than buys for Viper Hot Stock traders. This means we may be adding to our short positions next week.
Both the 4-5 page Viper ETF and Viper Hot Stock Reports are sent out twice a week and each report is only $34.95 each per month. New subscribers also receive regular and past Trading Lessons. The subscriptions can be cancelled on line at any time.
Comments
comments