

Most experienced commodity traders know that crude oil is one of the more volatile commodity markets where the gains as well as the risks are high. Having followed the crude oil market for thirty years I am still amazed how many try to trade this market based on fundamental analysis. Over the years through my past crude oil training sessions in Singapore and London I have made a number of converts.
This week the new head of one of the oldest commodity trading firms recommended shorting crude oil at $50-$55 according to Bloomberg based on bearish fundamentals. Those who follow the crude oil market may remember the negative headlines on crude oil as prices dropped in early 2016. The decline was based on the perceived weak demand, concerns over the economy and a rising trend in oil rig counts.
This data is the focus of the major financial news networks. In early January as crude oil prices were collapsing a Barclay's commodity analyst commented to CNN that "The fundamental situation for oil markets is much worse than previously thought." The sharp slide was due in part to small speculators dumping long positions. As was also the case during the July decline many jumped on the short side of the market based on these bearish forecasts.
Just a week later on January 21st I pointed out in "Time To Squeeze The Short Oil Speculators?" my analysis of the open interest (the number of crude oil contracts outstanding) suggested those on the short side were about to get squeezed. As it turned out crude oil made its low on January 20th.
Though many have maintained an overall bearish outlook on crude oil prices in 2016, the energy ETFs like the Energy Select Sector SPDR Fund (XLE) and SPDR S&P Oil & Gas Exploration & Production ETF (XOP) have outperformed the Spyder Trust (SPY) YTD by 10-15%.
As crude oil dropped below $40 in early August several analysts were calling for a drop to $35 or lower based on their negative fundamental analysis. On August 3rd, Zacks Equity Research even advised shorting oil and the energy ETFs (Oil in Bear Territory: Short Oil & Energy ETFs)
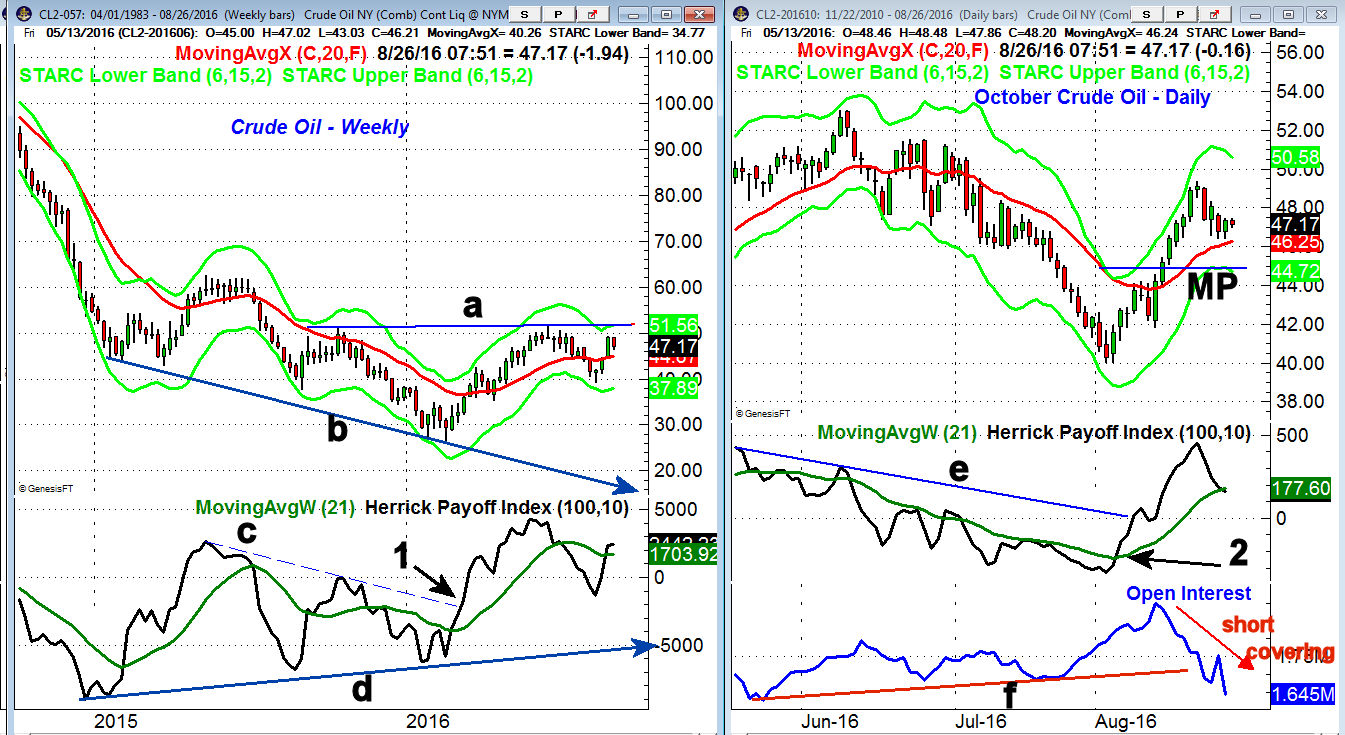
As was the case in January the technical outlook was much different in early August. A look at the weekly analysis will illustrate why the $50-$55 level is so important.
The weekly chart shows the doji low in early August and the key resistance in the $51 area, line a.
- A weekly close above this level would complete a reverse head and shoulders bottom formation as the August low may represent the left shoulder.
- The upside target from this formation is in the $75-$80 area.
- The Herrick Payoff Index (HPI) which uses volume, open interest and prices has been diverging from prices since 2015, line d.
- The HPI also formed a short-term divergence early in the year that was confirmed by the move above its WMA and the downtrend, line c.
- On the July drop the HPI dropped back below the zero line but moved back into positive territory just after the August lows.
The daily chart of the October crude oil contract shows the thirteen day rally from $40 to $49.36 which thoroughly confused the media and likely added to the mounting hedge fund losses.
- The daily HPI crossed back above its WMA on August 4th which was two days after the low.
- The downtrend in the HPI, line e, was broken as crude consolidated for two days before it accelerated to the upside.
- The HPI has just pulled back to its WMA suggesting that the recent pullback may already be over.
- The plot of the open interest shows an increase of almost 150,000 contracts from July 22nd to August 11th.
- The open interest has now dropped below the July lows, line f, as many of those new short positions have likely been forced to cover.
What to do? There were signs on Thursday August 18th that crude oil and the energy ETFs were close to a short term top. In the Viper ETF Report I follow the Energy Select Sector SPDR Fund (XLE), SPDR S&P Oil & Gas Exploration & Production ETF (XOP), Vanguard Energy ETF (VDE), the VanEck Vectors Oil Services ETF (OIH) and United States Oil Fund (USO).
In addition to my analysis of crude oil I use the relative performance of these ETFs to the Spyder Trust (SPY) along with the on-balance-volume (OBV) to determine when to buy and sell. Traders were long XOP from July 28th and took short term profits a week ago.
The bearish fundamental outlook and the recent shorting advice should be enough to push crude oil prices above key resistance and complete the major bottom formation. For serious crude oil traders I do a three hour class on using the HPI if you are interested email me at wentworthresearch@gmail.com for more information.
Comments
comments