

The better than expected jobs report gave the sagging stock market a boost as some investors became a bit less euphoric after a rough week for the Trump administration. In a January column I urged that investors and traders ignore the "Tweet storm" and make their decisions based on numbers not the noise.
There was certainly lots of noise since last week's "Wait For Signs Of A Trump Bear Market" that was unlikely to instill confidence in the new administration. However as I pointed out there were no signs of either a recession or bear market.
As the markets started the second month of a new quarter I wanted to look at how the markets did in the 1st quarter of past new administration and whether one can draw any conclusions about what we can expect this quarter.
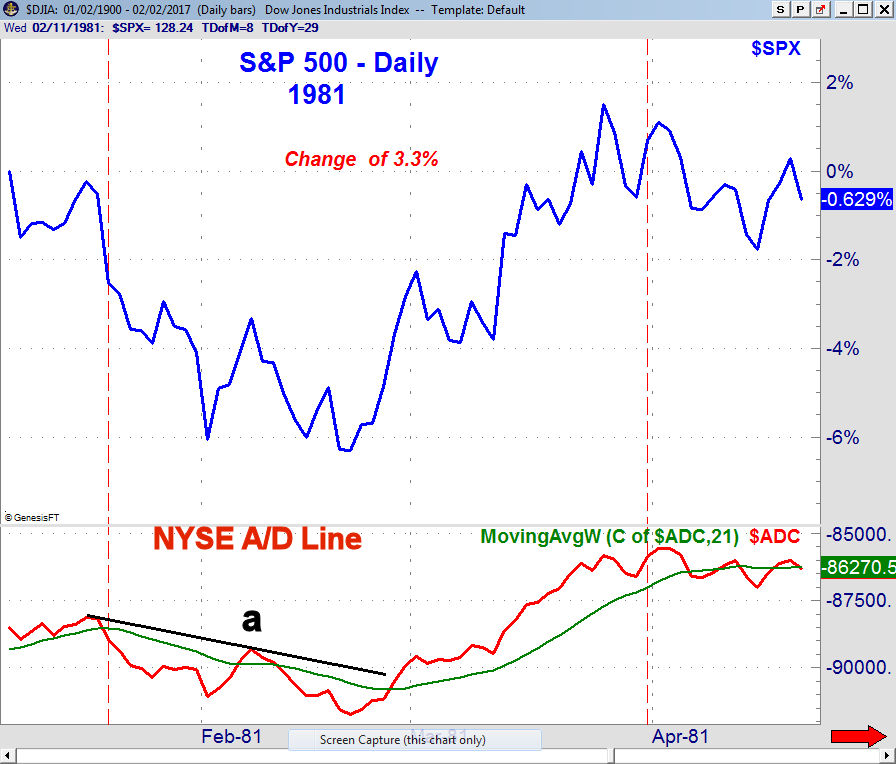
In 1981, the S&P 500 has dropped sharply ahead of the inauguration and the NYSE advance/decline line (One Indicator Stock Traders Must Follow) had just dropped below its WMA. The A/D line stayed in the corrective mode until February 26 when it moved above its downtrend, line a, and its WMA. The A/D line stayed positive until the end of the quarter as the S&P had gained 3.3% since inauguration day. The weekly A/D line was neutral.
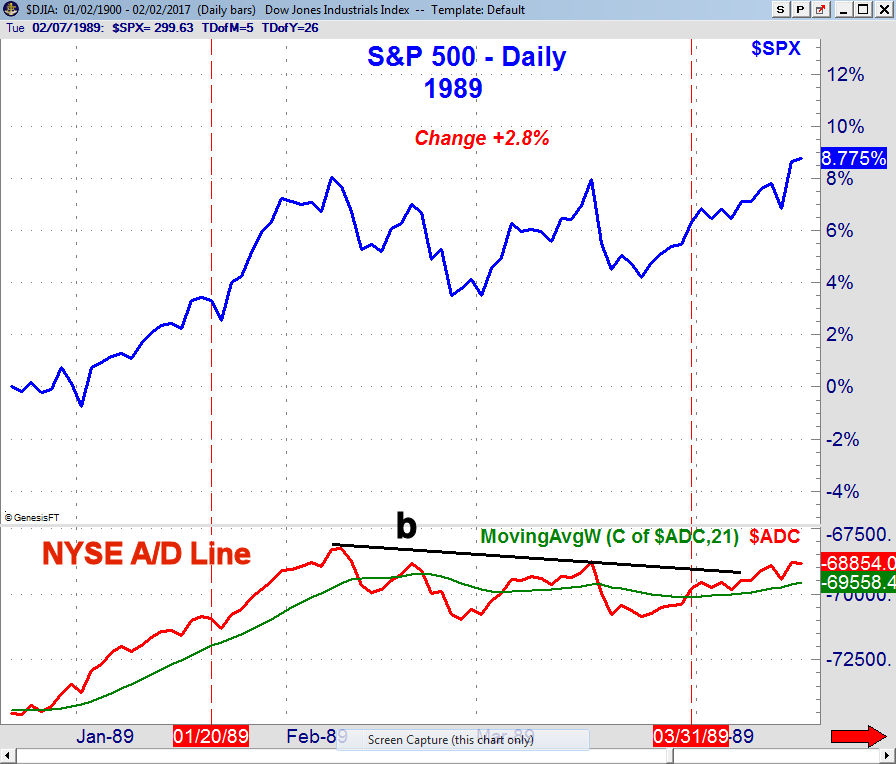
In December 1988 before the inauguration of George H.W. Bush in the 1989 the A/D line turned positive by moving above its WMA. By January 20th the A/D line was in a clear uptrend but then started to top out in February and developed a trading range, line b. This range was not completed until the end of the quarter as the S&P had risen 2.8%. The weekly A/D line was positive as it had just moved above its WMA prior to inauguration.
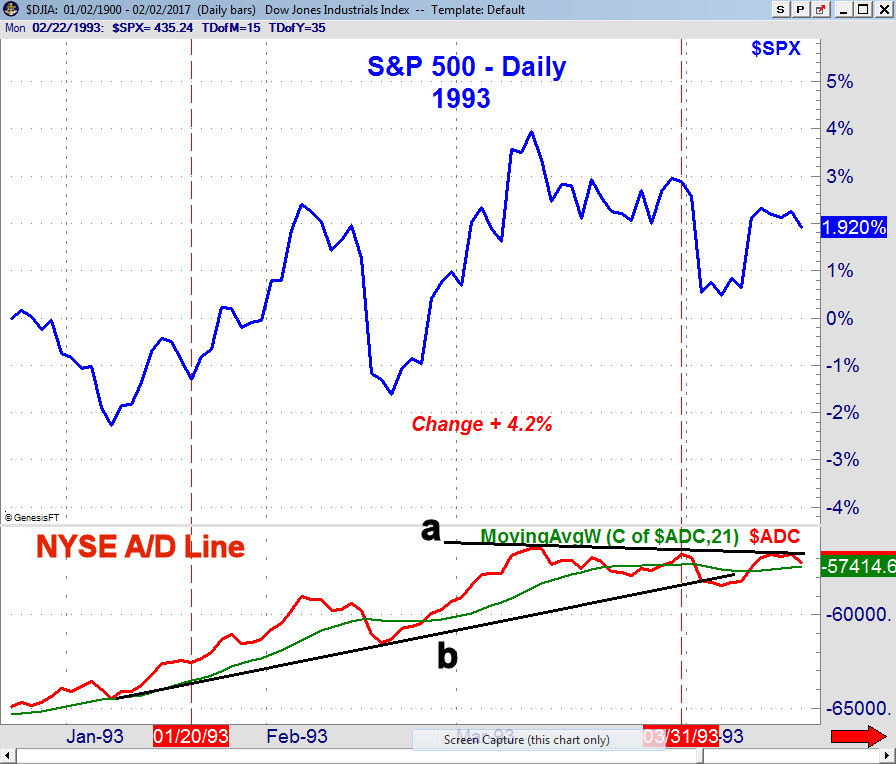
The NYSE A/D line was also clearly positive at the start of 1993 as it was well above its rising WMA by inauguration day. The A/D line dropped below its WMA for six days in the middle of February but then resumed its uptrend. In late March the A/D line dropped below its WMA and early in the 2nd quarter it dropped below the support at line b. The weekly NYSE A/D line moved above its WMA in November 1992 and by January the WMA was rising strongly.
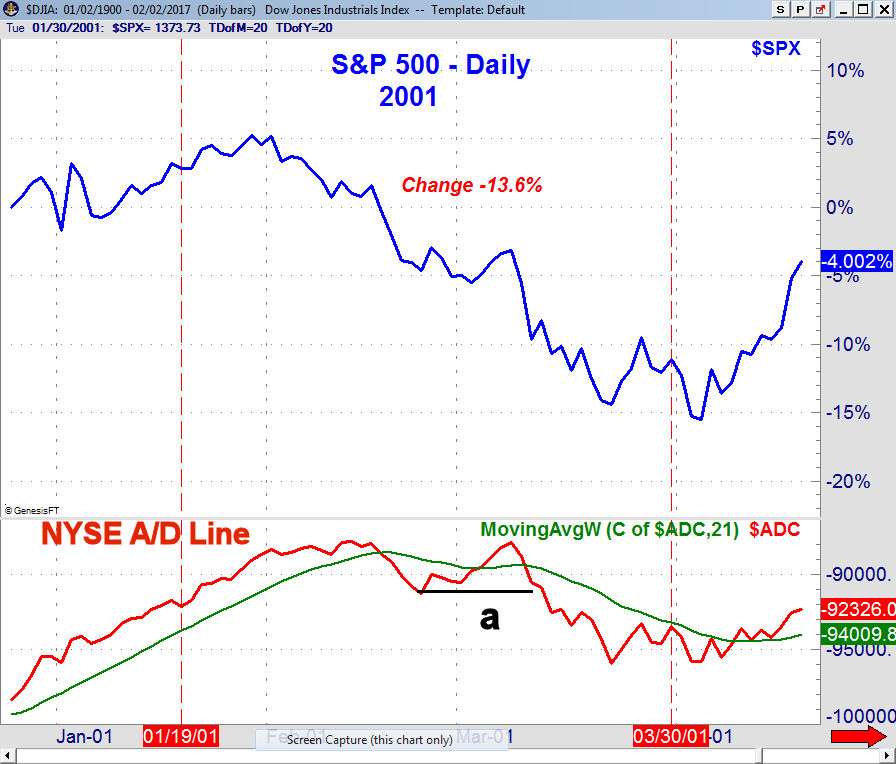
In 2001, the inauguration occurred on a Saturday when the NYSE A/D line was trending higher and was well above its clearly rising WMA. On February 16th it dropped below its WMA but the S&P had already topped out as it had already declined 5.2% from the February 1st high.
After the A/D line rebounded in early March it again started to plunge as it was in a well-defined downtrend. From January 20th through Friday March 30th the S&P 500 dropped 13.5%. The weekly A/D line was diverging from prices in early January and dropped below its WMA in March.
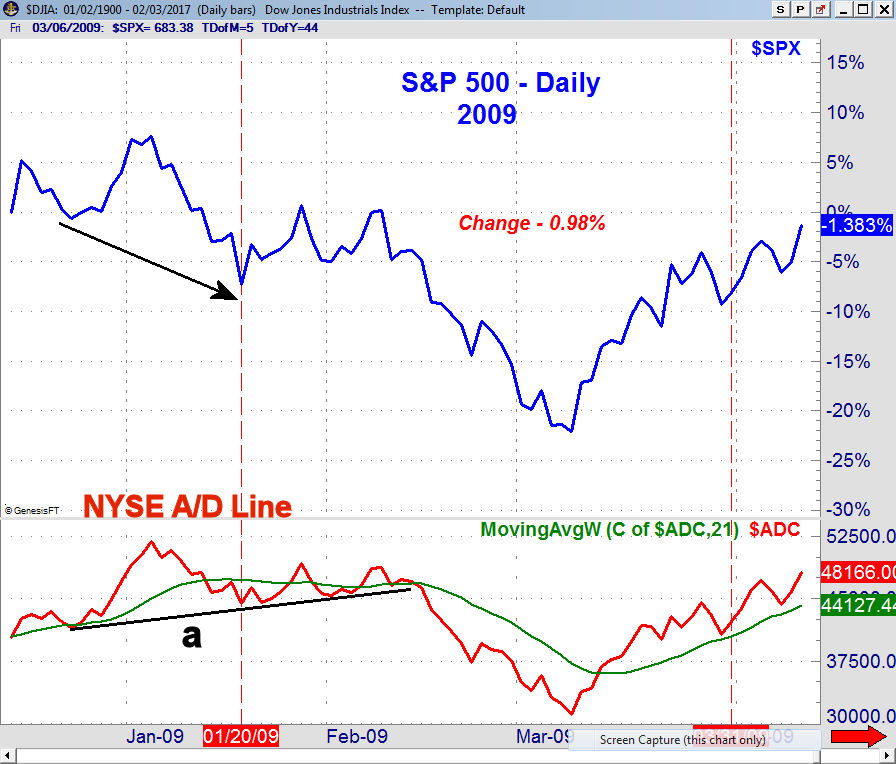
By the tine President Obama was inaugurated in 2009 the bear market in the S&P 500 was still intact as the S&P 500 had formed lower lows (see arrow). The NYSE A/D line bounced from support at line a and like prices stayed in a trading range until it broke support on February 13th.
The A/D line declined sharply until early March and did not move back above its WMA until March 12th. The S&P 500 rose almost 18% from the March lows but the S&P 500 was still down 0.98% since the inauguration.
The S&P 500 closed on January 20th 2017 at 2265 and as of Friday's close is at 2297.47. This is a gain 1.4%. The NYSE A/D line has been above its WMA since November 15th but has since frequently tested its rising WMA. The weekly A/D line moved back above its WMA on November 25th and made new highs in early December. It has continued to record higher highs.
So what might this mean for the first quarter of 2017? A close at the end of the quarter at 2350 would mean a gain of 3.5% which is reasonable while a move to 2400 or $240 in the Spyder Trust (SPY) would mean a rise of 5.9%. Given the technical indicators I think the Spyder Trust (SPY) could reach 2400 between now and the end of the quarter.
Some of the ETFs I have been recommending to Viper ETF clients like the Vanguard Financials (VFH) and the SPDR S&P Biotech (XBI) should do even better.
The Economy
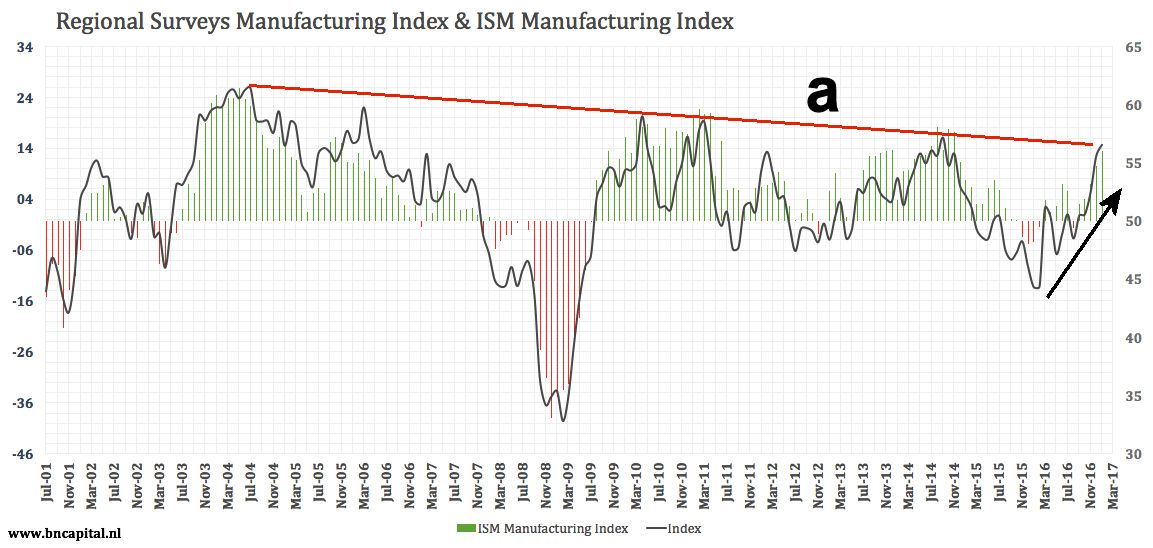
There was a full slate of economic data last week and while the Chicago PMI was a bit weaker than expected both the PMI Manufacturing Index and the ISM Manufacturing Index were both better than estimated. The long term chart of the ISM shows that it is on the verge of breaking above the resistance, line a, that does back to 2001. The ISM has been improving sharply since late March.
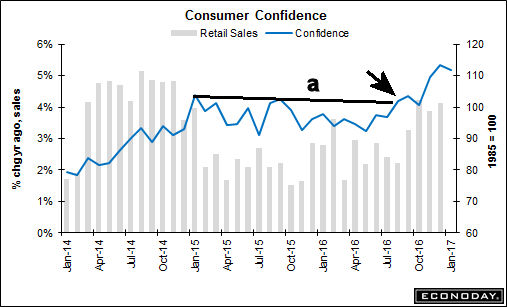
Factory orders were also stronger than expected with the PMI Services Index at 55.6 up from 53.9 the previous month. The ISM Non-Manufacturing Index was a bit lower as was the Consumer Confidence at 111.8. It was revised to 113.3 last month. The chart shows that it broke through resistance (line a) last September and has started a clear new uptrend.
Pending Home Sales rose 1.6% last month and the S&P Corelogic Case-Shiller HPI was up an impressive 0.9%. This was the largest gain since March 2015.
There is a very light calendar this week with Import and Export Prices as well as the Consumer Sentiment on Friday.
Interest Rates & Commodities
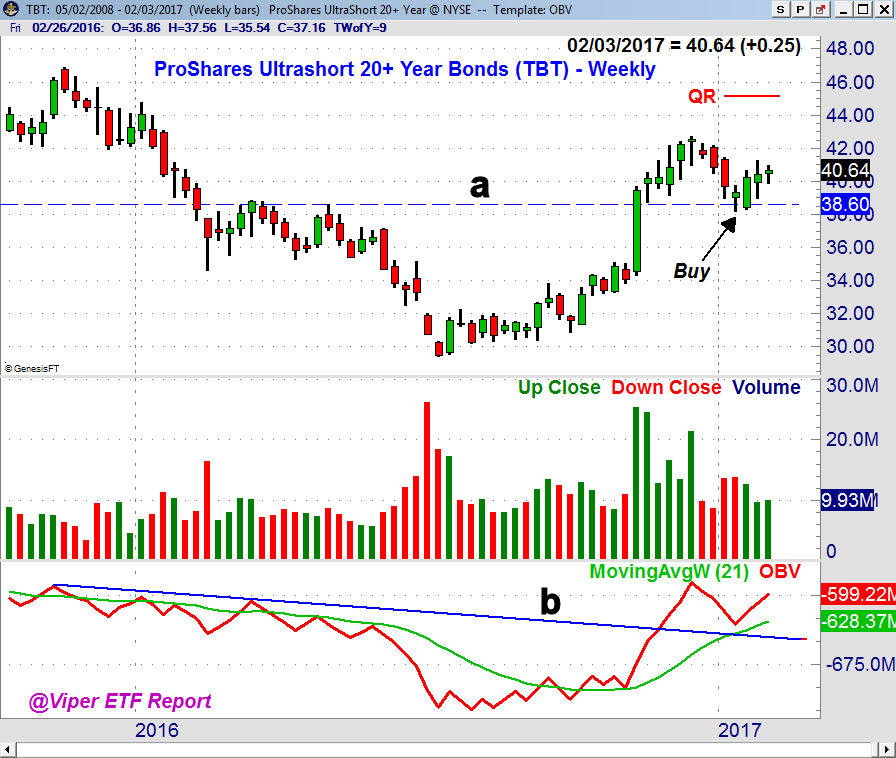
The yield on the 10 Year T-Note rose slightly last week and the lower wage growth in Friday's job report has more now looking for a rate hike in May. The weekly chart of the inverse iShares Proshares 20+ year Bond (TBT) appears to have completed its correction 4 weeks ago as it dropped down to good support at line b.
On a move above the late 2016 high of $42.72 the quarterly pivot resistance (QR) is at $45.25. The weekly OBV bottomed in early November before the election and just pulled back to its rising WMA on the correction. It is acting stronger than prices.
The April Crude oil contract was higher last week and the daily indicators are now positive. Still a move above $57 is needed to signal upward acceleration. There is initial weekly support now at $52.40.
The gold and gold mining stocks closed the week higher and the weekly studies do suggest that a bottom is in place. However they are extended so a pullback should be a good buying opportunity.
Market Wrap
Even though stocks rebounded sharply Friday with the Dow Industrials recording the best day in two months but it still closed the week slightly lower. The Dow Transports were the weakest down 2.1% while the Russell 2000 gained 0.52%. The slightly higher close in the broadly based S&P was a plus as was the 1914 to 1184 positive margin in advancing over declining stocks.
According to AAII the bullish % of individual investors rose 1.2% last week to 32.8% and the bearish % was up a bit at 34.2%. It has been above 30% for three weeks in a row. This is what one would expect during a correction. The CNN Fear & Greed bounced to 60 on Friday up from 51 and is in greed territory. It was 70 a month ago.
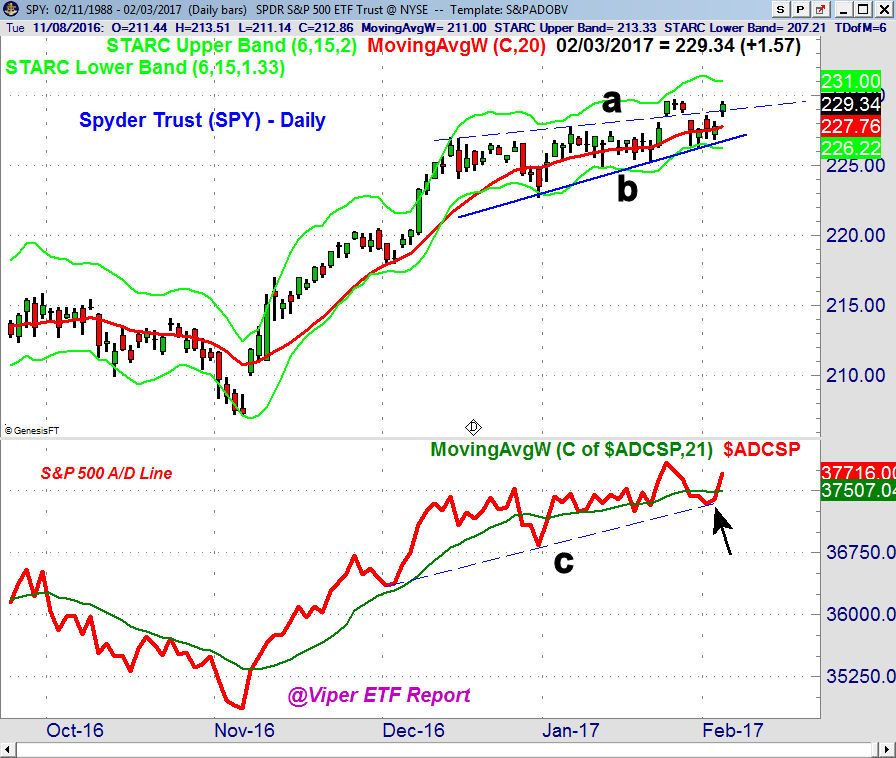
The Sypder Trust (SPY) spent most of the week trading above and below the 20 day EMA which is now at $227.76. The close was back above the breakout level, line a. The flag formation has upside targets in the $232-$234 area with the weekly starc+ band at $234.99. There is quarterly pivot resistance at $240 and the yearly projected resistance from a recent Viper Trading Lesson is at $241.26.
The S&P 500 A/D line turned up from support at line c (see arrow) and closed well above its WMA. This reinforced the uptrend and the weekly A/D line closed at another new high. There is first chart support at $226.41 which was the week's low with further at $225.
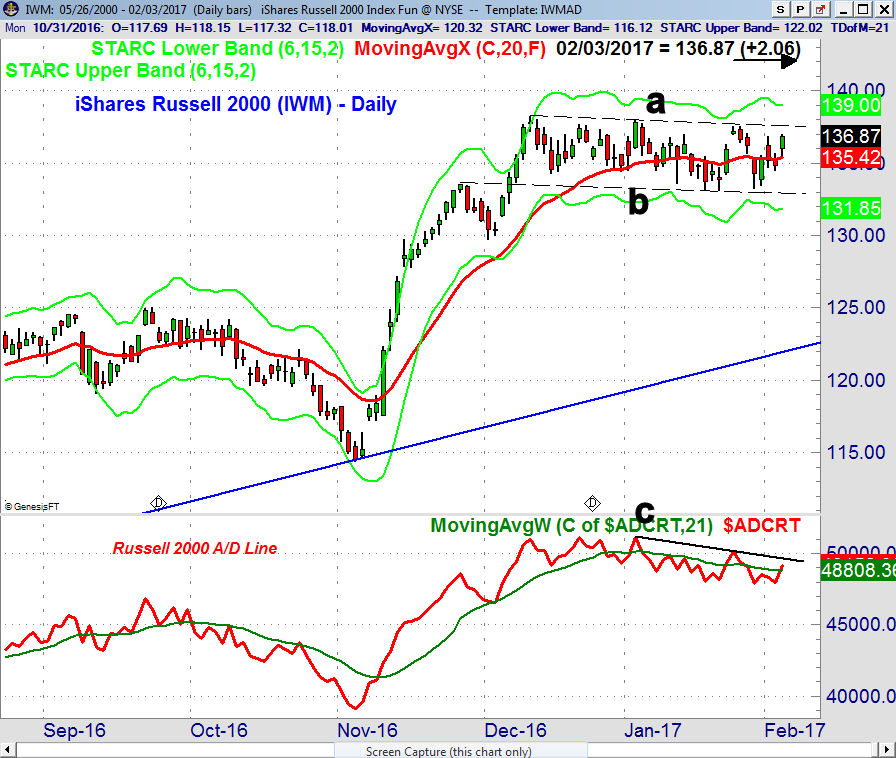
The broad trading range in the iShares Russell 2000 (IWM) has been in effect since the December 9th high at $138.25. For the past month I have been pointing out that this is likely a continuation pattern or a pause in the uptrend. It has lasted long enough to turn many negative on the small cap stocks which is quite normal.
On the upward completion of the trading range the initial targets are in the $144 area (see arrow) which also corresponds to the quarterly pivot resistance. There is good support in the $133-$133.50 area and the late November highs. The daily Russell A/D line has moved back above its WMA and needs to overcome the resistance at line c, to signal that the correction is over.
Viper traders and investors are still long the PowerShares QQQ Trust (QQQ) from December. It closed a bit lower last week but the weekly and daily A/D lines made further new highs. The QQQ and XLK shows no signs yet of a top.
What to do? I last looking for a higher weekly close last week to confirm that the correction was over but I had to wait until Friday. I have been favoring the SPDR S&P Regional Banking ETF (KRE) and the Vanguard Financial (VFH) which have become out of favor on Wall Street. Both closed up 2% on Friday and a move to new highs this week will be bullish for the overall market.
It will take several more days of strong market internals to start the A/D lines trending higher. this would increase the odds of another 4-6% on the upside. Even on the down days last week the A/D numbers were not too bad and it would take a few days of 3 or 4 to 1 or worse negative A/D numbers to turn the daily A/D lines back into the corrective mode.
New negative intermediate term signals from the A/D lines would take many weeks or several months to develop. This indicates the market can move higher at least until the spring.
If you would like specific buy and sell advice you might consider my Viper ETF Report or the Viper Hot Stocks Report . New subscribers receive five past Trading Lessons which are in-depth lessons on using pivots, stops, candle formations as well as determining both entry and exit levels. The ETF and Stock reports are sent out twice a week and each report is only $34.95 each per month.
Comments
comments