

Stocks held firm to start off the week but spent the rest of the week declining as the S&P 500 lost over 26 points which was the worst weekly decline since March. The S&P 500 is now down almost 3% from the March 1st high but the small cap Russell 2000 is down 4.8%.
President Trump's reaction to the global tensions in the Middle East and in Asia has added to the investor's wall of worry I focused on last week. His efforts to talk the dollar lower are likely to have an impact the overseas markets which have been outperforming recently.
Investors have lost some of their enthusiasm for the stock market over the past month and last week's 3.2% decline in the SPDR KBW Bank ETF (KBE) will not help as it was one of the hottest sector ETFs in the early stages of the Trump rally.
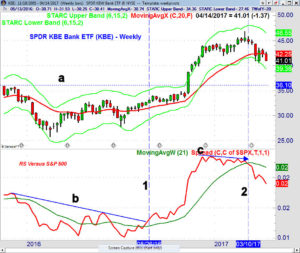

The weekly chart shows that the relative performance broke its downtrend , line 1, on August 26, 2016 and two weeks later surpassed its previous peak. The RS stayed in a solid uptrend until the post election surge as KBE moved above the major resistance in the $36 area, line a.
In early December KBE finally started to consolidate after it traded above its weekly starc+ band for several weeks. The sideways pattern continued until mid-February when KBE again pushed to a new high just below $47.
KBE was not leading the S&P 500 on this rally as is indicated by the lower highs in the RS, line c. The RS dropped below its WMA one week after the high on March 10th. The RS has dropped further since it moved below its WMA and it is now in a solid downtrend. KBE bounced up to the 2nd quarter pivot at $43.51 before last week's drop and now may be ready to test the quarterly pivot support at $40.29.
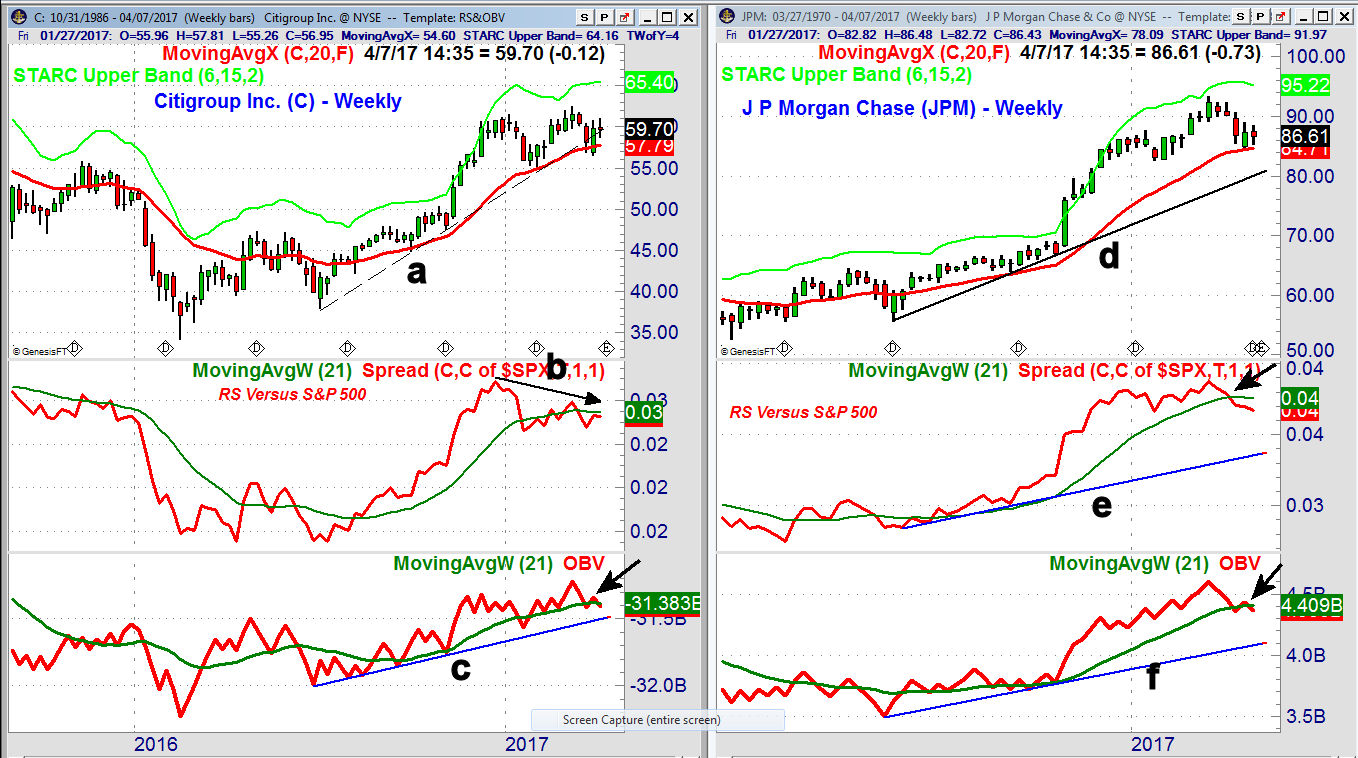
Last week's earnings from Citigroup (C) and JPMorgan Chase (JPM) were better than expected but even though both stocks opened higher on Thursday the sellers quickly took over. The lower weekly close has moved the weekly indicators even further into the sell mode as they were already negative last week.
Given the weak action in the financial stocks it is not surprising that according to the latest AAII survey the bullish % of individual investors is quite low at 29% while the bearish % is at 37.4%. The bullish % typically drops to the 18-22% area before a significant bottom is formed. Of course once the bullish sentiment hits a low then it is the technical studies that identify a bottom as they did last February.
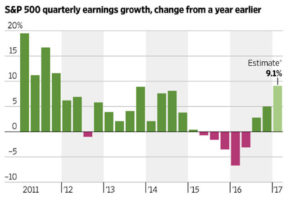

Many investors are worried that the earnings season will not justify the current stock prices. As the chart indicates after five quarters of negative growth a new uptrend started in the third quarter of 2016. According to FactSet "The blended earnings growth rate for Q1 2017 is 9.2%. If the index reports earnings growth for Q1, it will mark the first time the index has seen year-over-year growth in earnings for three consecutive quarters since Q3 2014 through Q1 2015."
In their opinion the best year-over-year growth in earnings will come from the following sectors; energy, financials, materials, and information technology. Of course the energy ETFs are the most beaten down even though they have bounced recently. They could be the surprise winner for the last half of the year.
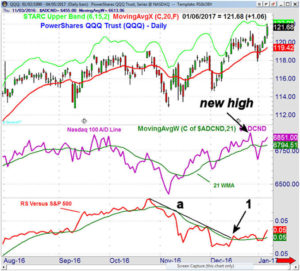

The technology ETF, including the PowerShares QQQ Trust (QQQ), continue to look the best technically as they have since the end of 2016. In a January 8th Tweet I reviewed may analysis that was based on both the weekly and daily analysis of QQQ.
In my view it was very significant that the daily Nasdaq 100 A/D line (in purple) made new all time high on December 27th as it exceeded the high from September 22nd. This was a strong sign that the major trend was positive and that new price highs were now very likely.
The daily RS analysis indicated that QQQ was becoming a market leader. On the bottom of the chart is the relative performance (RS) in red with a weighted moving average. The downtrend in the RS, line a, was broken on December 13th which was the first step in becoming a market leader. On Friday January 6th the RS moved above its recent high which completed the bottom formation.
As the stock market corrects further I am watching many of the sector ETFs to see which ones will become the new market leaders. In last week's action there were a few ETFs that are starting to lead the market higher.
There are also a number of global and country specific ETFs which look ready for an overdue pullback that could be triggered in part by further weakness in the dollar. It does look as though our new president is helping to create a new buying opportunity in both US and global stocks.
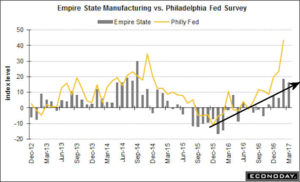

Next week we get new data on two economic reports, the Empire State Manufacturing Survey on Monday and the Philadelphia Fed Business Survey on Thursday. Both indicators bottomed last summer and continue to look strong as the Philly Fed shows an especially strong uptrend.
Also out next week is the Housing Market Index on Monday with Housing Starts and Industrial Production on Tuesday. On Thursday we get the all-important Leading Indicators with the flash PMI Composite and Existing Home Sales on Friday.
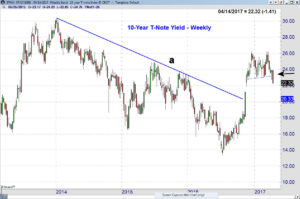

The yield on the 10-year T-Note broke support at 2.300% last week and closed just above the yearly pivot. There next support from the weekly chart is in the 2.12-2.180% area but the break of the thirty-month downtrend, line a, last November is still the dominant technical signal. It is now in trhe 2.03% area.
Market Wrap
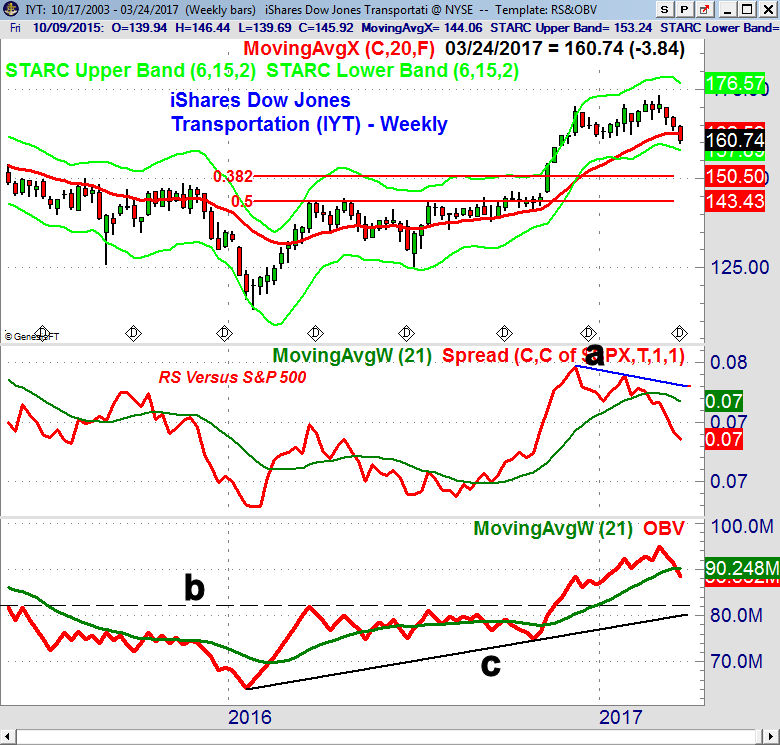
Last week both the Dow Industrials and S&P 500 were down 1% while the Nasdaq 100 lost 1.2%, slightly better than the 1.4% loss in the small cap Russell 2000. The Dow Transports did the worst losing 2.53% which was consistent with the negative weekly outlook I discussed in late March.
The weekly A/D ratio was negative with 1300 stocks advancing and 1768 declining. There were 211 stocks making new weekly highs with just 47 stocks making new lows. The lack of a sharp surge in the number of new lows so far is a sign of market strength.
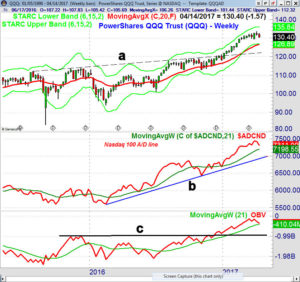

The close in the PowerShares QQQ Trust (QQQ) below last week's doji low of $131.50 triggered a sell signal. The monthly pivot support at $130.28 has been reached with the quarterly pivot at $128. On the weekly chart the starc- band and 20 week EMA are in the $126.90 area. There is long-term support from the breakout level, line a, in the $122 area. The monthly pivot at $131.58 is the first barrier on the upside and a close above $132.57 would indicate that the short-term trend is again positive.
The weekly Nasdaq 100 A/D line has turned down but is still well above its rising WMA which is a positive sign for the intermediate term trend. The daily A/D line has dropped further below its WMA which has now flattening out. The weekly OBV is also still above its WMA.

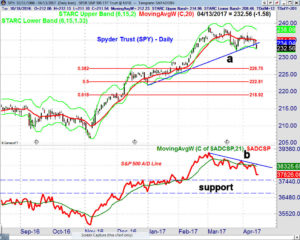
The Spyder Trust (SPY) closed the week below the quarterly pivot at $233.31 and the daily support at line a. It settled right on the 20 week EMA with monthly pivot support at $231.46. The weekly starc- band is at $230.56.
The $229-$230 area is the next widely watched support level which is about 1% lower. The quarterly pivot support is at $226.30 which is just below the 38.2% support from the November which stands at $226.70. The 20-day EMA has turned down and is now at $235.01 with the monthly pivot at $235.89.
The decline in the daily S&P 500 A/D line accelerated last week as it dropped well below the March lows. The A/D line has reached the support from the January high with a band of much stronger support just a bit lower. The weekly A/D line has now dropped below its rising WMA for the first time since November 11th. It did not form any divergences at the highs which is positive for the intermediate term.
The weekly and daily A/D lines for the Dow Industrials and Russell 2000 are below both their WMAs though I would not be surprised to see the small cap stocks bottom out first.
What to do? The sellers took over last week which has pushed the daily A/D indicators further into the sell mode. The weekly A/D line is the strongest on the QQQ and weakest on the IWM. The lack of any weekly negative divergences like those which occurred in 2015 still indicates that this is a correction within a positive intermediate term trend.
If you are underinvested then I would look to add another 10% or more of your planned investment in broadly based ETF if the SPY drops below $230 and 20% more on a violation of the $227 level. Both Viper ETF investors and traders are still long a number of sector ETFs and there are two that are now appearing as new market leaders.
The current correction should also be an opportunity to establish additional positions or add to existing positions in some of the global ETFS that have been doing quite well.
The current decline should provide some good trading opportunities on the short side of stocks covered in the Viper Hot Stocks Report as well as some good buying opportunities in some of the strongest stocks that are having an overdue correction.
Both the 4-5 page Viper ETF and Viper Hot Stock Reports are sent out twice a week and each report is only $34.95 each per month. New subscribers also receive regular and past Trading Lessons. The subscriptions can be canceled on line at any time.
Comments
comments