

Last week's strong stock performance and bullish market internals were consistent with the resumption of the post-election rally. The stock market's narrow range and the failure to exceed the January highs had put many investors as well as traders on the sidelines.
In fact bulls have been hard to find as even the new Dow high at the end of January was not enough to turn many bullish. This decline in the bullishness was evident from the AAI survey as the bullish % dropped from 46.2% on January 5th to 31.6% on January 26th.
In last week's "Is Bullish Sentiment Now Low Enough?" the focus was on how the advance/decline lines overall were giving a much more bullish outlook for the markets. The NYSE, S&P 500 and Nasdaq 100 A/D lines all made new highs on Thursday which confirmed the price action.
Despite the new highs the focus of many is on why the market cannot possible go much higher. Articles frequently focus on how high the P/E ratios are from a historic standpoint which is used to argue that stocks are not cheap and that investors should not buy.
In January's article "Wait For Signs Of A Trump Bear Market" I urged investors to wait for signs of a Trump bear market before paying too much attention to any fundamental argument as to why stocks were topping out. A correction of 5-10% is always possible but over the past thirty years the majority have been signaled in advance by advance warnings from the A/D lines. There are no such warnings at this time.
So what is an investor to buy so that the risk is manageable?
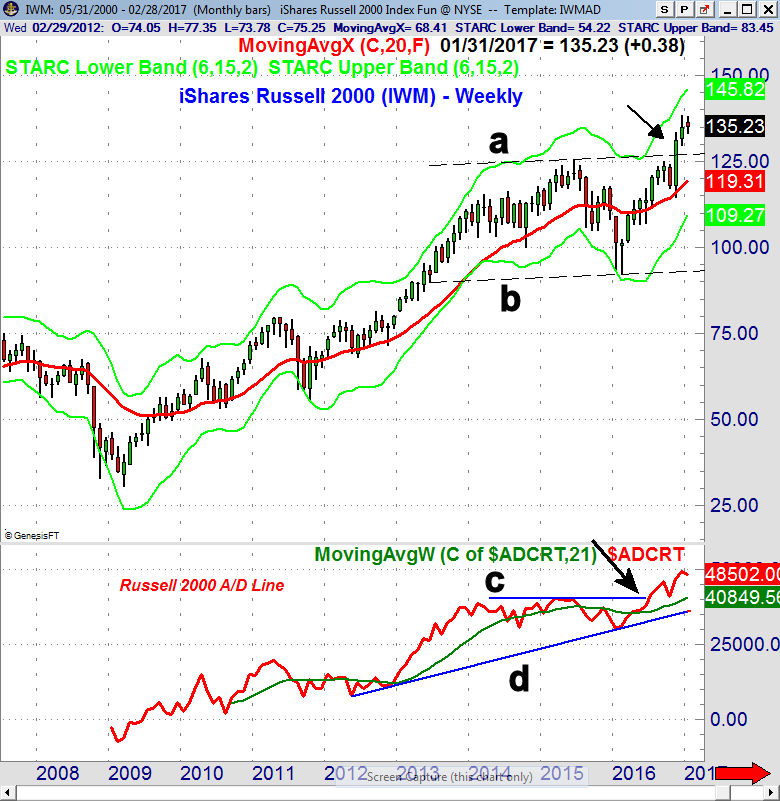
In November I pointed out that the monthly chart of the small cap iShares Russell 2000 (IWM) had completed a trading range, lines a and b, that went back to 2013. At the time many were also complaining about too high P/E ratios. Using the width of the formation the upside targets are in the $148-$150 area. The Russell 2000 A/D line had completed its trading range (lines c and d) in July as it was leading prices higher.
The initial yearly pivot resistance for the IWM is at $151. Based on the January close a rally to $150 would be a gain of 11%. The underlying Russell 2000 has not made a new high yet but based on last week's action it could this week.
The Spyder Trust (SPY) has initial yearly pivot resistance at $241.28 while PowerShares QQQ Trust (QQQ) has next yearly resistance at $128.73. Viper ETF investors and traders are long IWM, SPY and QQQ as well as the Vanguard Small Cap Growth ETF (VBK).
How about individual stocks?
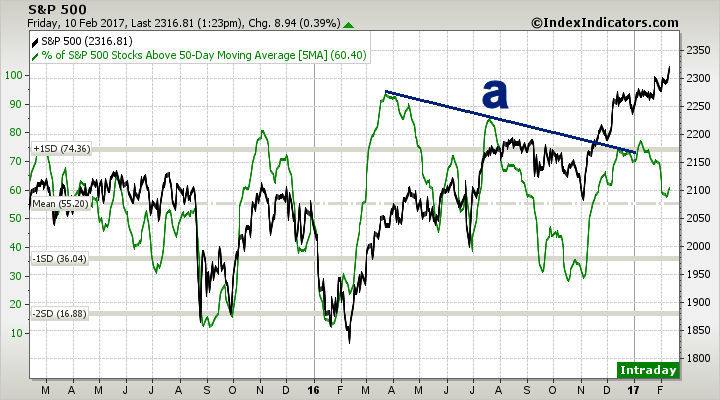
The decline in bullish sentiment was accompanied by a decline in the % of S&P 500 stocks above their 50 day MA. In early January the 5-day MA of this % peaked above 74% but has since declined almost to the mean at 55.2%. It is well below extreme levels in the 80-90% area. The downtrend in the 5-day MA, line a, was broken in November which was a positive sign.
In recommending stocks for the Viper Hot Stocks report I do a weekly and monthly scan of over 150 stocks. As part of the selection process I carefully examine the long term charts of the stocks that turn up in my scans. One such stock is Mylan Inc. (MYL) which has been suffering from the negative press because of their sharp increase in EpiPen prices.
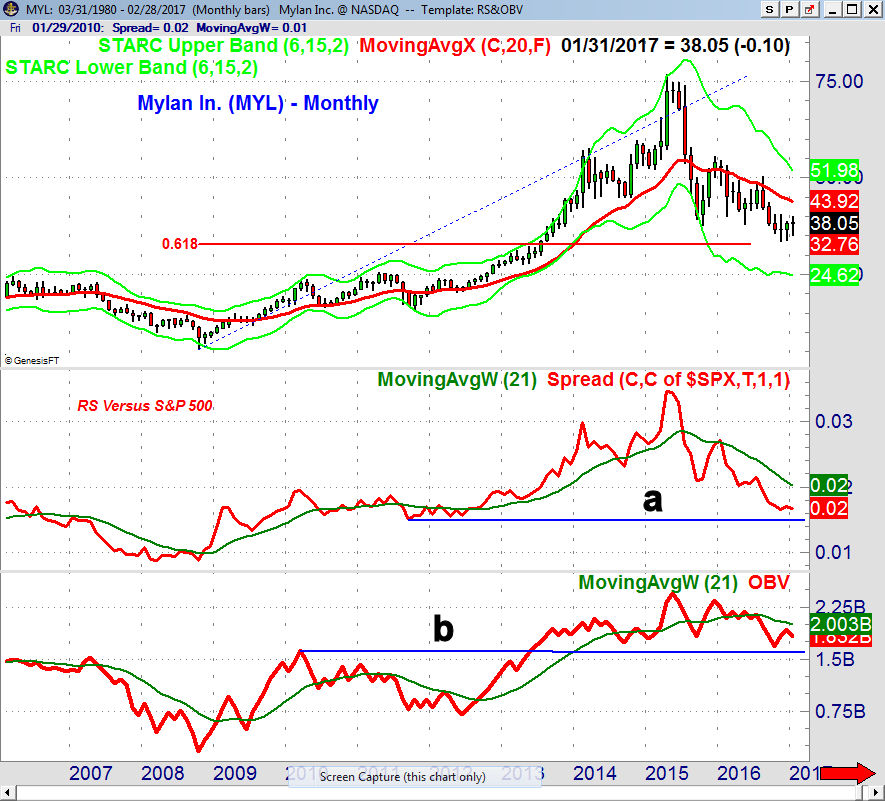
The monthly chart shows that MYL came close in both November and December to the 61.8% Fibonacci support at $32.76 that was calculated from the 2008 low of $5.75. The high in 2015 was $76.68 as it reached the monthly starc+ band. The stock is now about 50% below its 2015 high.
A monthly doji was formed in November so a February close above $40.50 will trigger a doji buy signal. The declining 20-month EMA is at $43.92. The monthly relative performance (RS) is still in a clear downtrend and is well below its WMA. The OBV is stronger as it has bounced from major support at line b. It could move back above its WMA in the next month or two.
Of course just because a stock has been weak for the past year or more is not a reason to buy. A look at the weekly RS shows that it could move above its WMA this week and the OBV is already positive. Though Viper Hot Stock traders are not currently in MYL they are long Vantiv (VNTV). Positive relative performance and volume are consistent with a bottom formation.
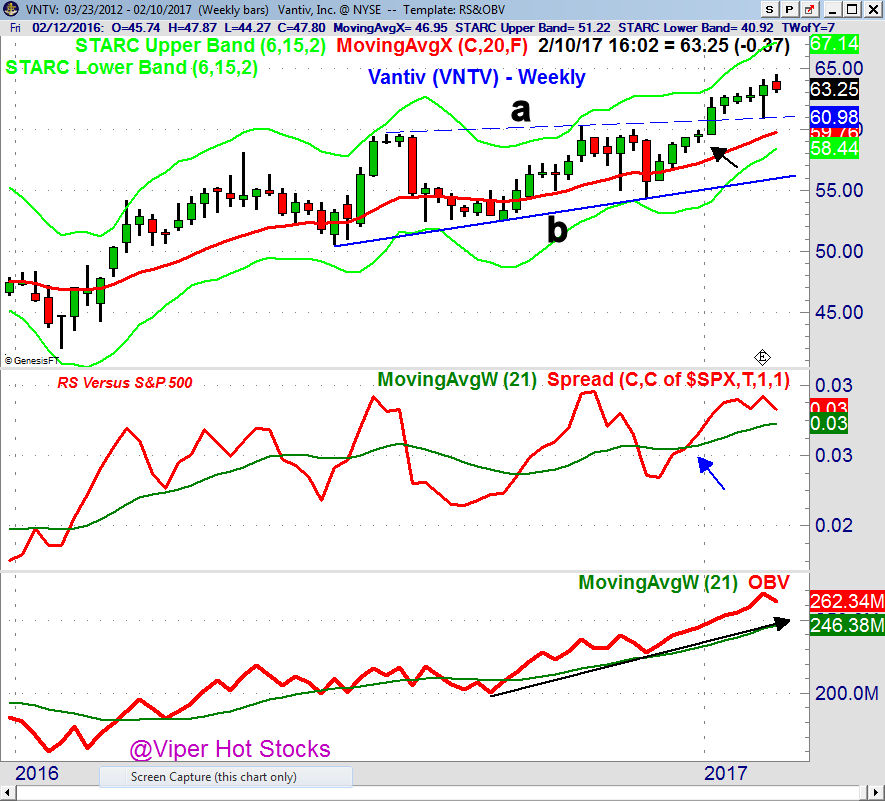
When a stock breaks out of a thirty week flag formation, lines a and b, as was the case for VNTV in early January it can create a good risk/reward opportunity. The formation has upside targets in the $66 area and on the breakout initial stops could be placed under the late December low of $58.90 (see arrow). The breakout level was tested last week but VNTV then closed strong. The weekly RS and OBV analysis have been positive since late last year.
One of the best sites (Four Go-To Investment Research Sites) that I have found for looking at a large number of charts is Finviz.com. It gives you the capability to look at all stocks in a industry group and then switch from daily, to weekly or monthly on an individual stock. On their free site you can also scan for chart formations, unusual volume as well as a host of fundamental criteria.
Whether you are planning to buy a stock or ETF I always encourage all to do their own research and to concentrate on the risk not the potential reward. If you do this and use the starc bands it will help keep you from buying too high.
The Economy
Friday's mid-month Consumer Sentiment survey came in at 95.7 which is down a bit from last month's reading at 98.5. Still it is a strong number which is a plus for 2017.
This week the calendar is much more crowded as Wednesday we have the Consumer Price Index, Retail Sales, Empire State Manufacturing Survey, Industrial Production, Business Inventories and the Housing Market Index.
On Thursday we have Jobless Claims, Housing Starts, the Philadelphia Fed Business Outlook Survey and then Leading Indicators on Friday.
Interest Rates & Commodities
The yield on the 10 Year T-Note traded in a wide range last week as after closing the prior week at 2.491% they dropped to a low of 2.325% on Wednesday. The yields rose the last two days of the week to close at 2.409%.
The daily yield chart still shows a flag formation but a move above 2.555% is needed for an upside breakout. A daily close below the 2.30% level would violate support going back to November and would suggest a drop towards the yearly pivot support at 2.220%.
The April crude oil contract rallied sharply from Wednesday's low at $51.86 on news that the OPEC measures to reduce production are actually working. Crude sill closed the week a bit lower so this week's close will be important.
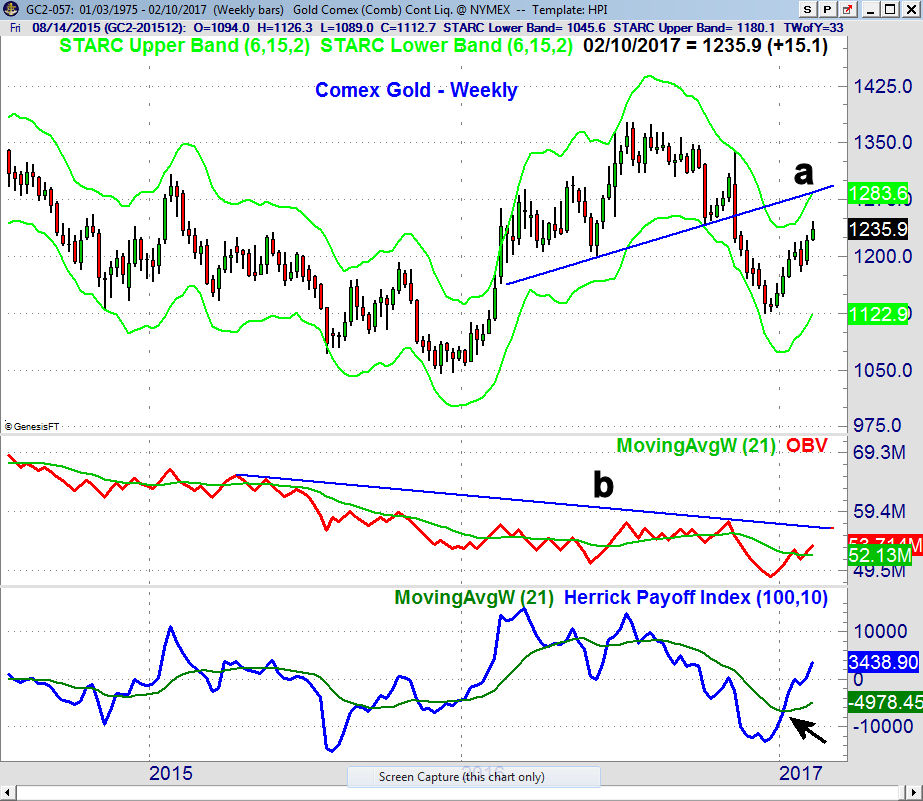
The Comex gold futures have rallied $100 from the mid December lows and have retraced 50% of the decline from the July highs. The former support, line a, is now important resistance. It is in the 1284 area along with the weekly starc+ band and the 61.8% resistance level.
The weekly OBV is above its WMA but still below the downtrend, line b. The HPI is back above the zero line and its WMA. The daily indicators are not impressive and they do suggest a failing rally.
Market Wrap
It was a bullish week for stocks after a lackluster start as they accelerated to the upside on the last two days of the week. The Dow Industrials were up 1% while the Transports gained 1.6% for the week. The S&P 500 was up 0.80% as was the Russell 2000 but the Nasdaq 100 gained over 1.3%.
Though there have been some downside surprises in earnings it has been the good quarter as I was expecting late last year. According to Thomson Reuters quarterly earnings may grow by 8.4% in the 4th quarter which validates the higher stock prices.
Consumer Goods were up 1.5% with consumer services gaining 1.4% while technology and industrials sectors were both up over 1%. Even though banks stocks rallied late in the week the financial stocks were up just 0.44%.
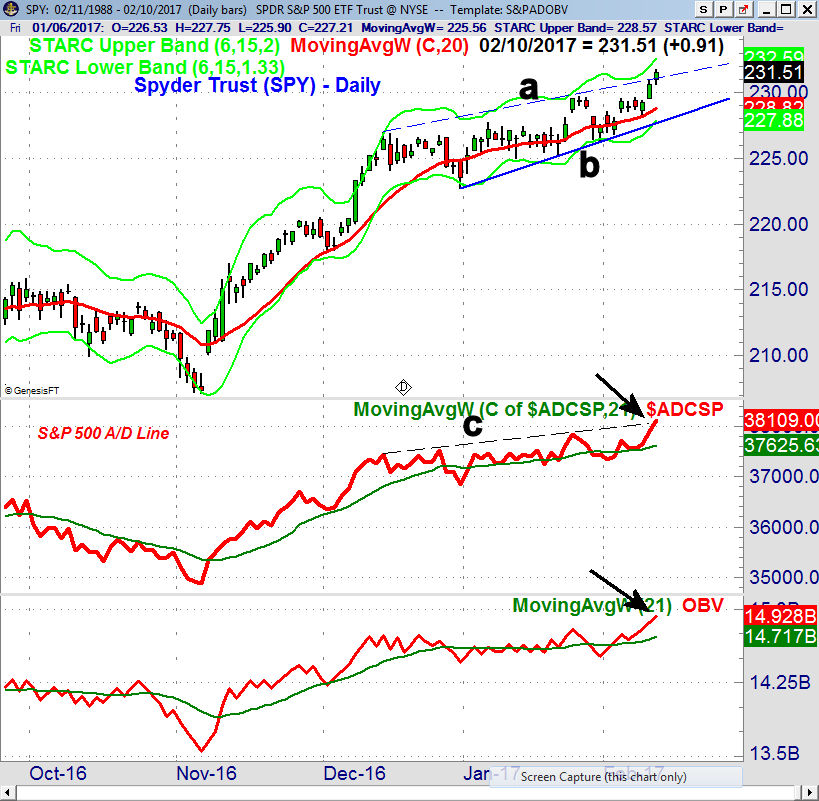
The Spyder Trust (SPY) closed above the upper boundary (line a) of the rising wedge formation which is a bullish sign. There is monthly pivot resistance at $232.87 with the weekly starc+ band at $236.30. The 20-day EMA at $228.82 was tested Wednesday before prices turned sharply higher.
The S&P 500 advance/decline line also broke through its resistance, line c and confirmed the price action. The weekly A/D line (not shown) also made new all time highs last week. The daily OBV has also risen sharply and is clearly positive as is the weekly OBV.
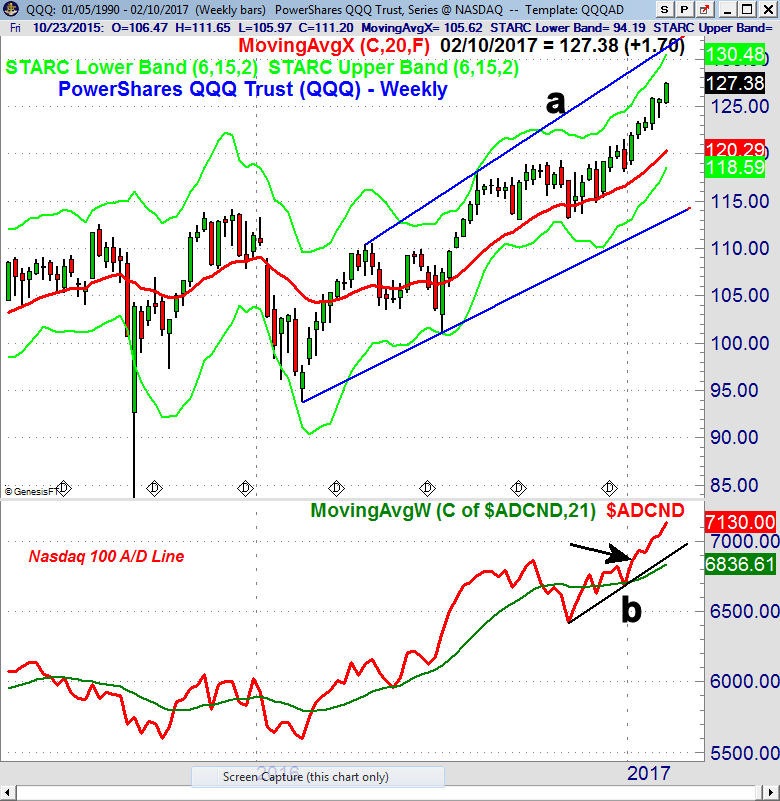
The close last week in the PowerShares QQQ Trust (QQQ) was impressive. The daily starc+ band is now at $128.13. The trend line resistance, line a, along with the weekly starc+ band and monthly pivot resistance are in the $130-$131 area.
The weekly Nasdaq 100 A/D line broke out to the upside in early January (see arrow) and has since accelerated to the upside in impressive fashion. The A/D line is well above its rising WMA as is the daily A/D line which has also made new highs.
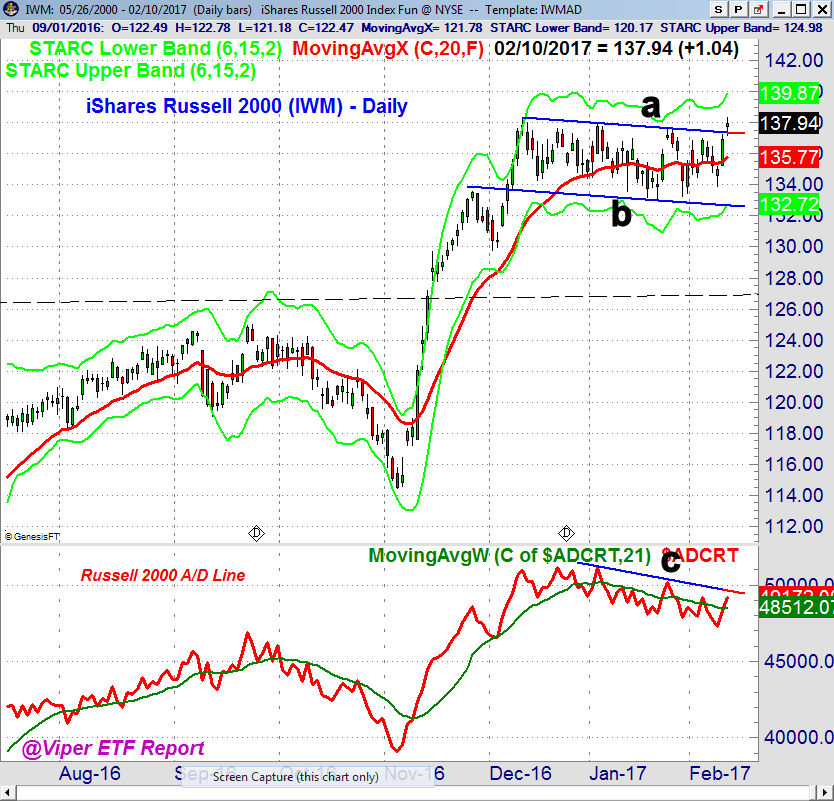
The iShares Russell 2000 (IWM) closed above its downtrend, line a, on Friday. Though it is still below the December high at $138.25 it should complete the continuation pattern that we have been watching for the past month. This supports my view that it was a continuation pattern not a top that was forming.
The Russell 2000 A/D line closed the week back above its WMA but is still slightly below the downtrend, line c. The weekly A/D line is positive and is holding well above its WMA. The next upside targets are in the $143-$144 area but once the small caps start moving they could go even higher.
What to do? The strong close last week favors more gains this month. The completion of the daily flag formation in the S&P futures has upside targets at 2330 and then 2340. The recent buying in the small cap stocks indicates that they could start leading on the upside.
Many fundamental analysts and media traders have been cautious on the market since the start of the year while my A/D line analysis has kept me bullish. The basis of this analysis was reviewed again last week.
Back in April I suggested that "those who were not invested should consider a dollar cost averaging program where six equal investments were made over a period of time. Those non-active investors should consider a broadly diversified ETF like the Vanguard Total Stock Market ETF (VIT) or the Vanguard MSCI Europe (VGK)."
I would not be chasing the technology stocks at this time as Viper ETF investors and traders are long QQQ and XLK from much lower levels. For new longs the small cap stocks look the best though longs in both IWM and the Vanguard Small Growth (VBK) were previously recommended. It will take several more days of strong market internals before the Russell 2000 A/D line starts to trend higher and confirms much higher prices.
I do expect to see a 5% or more correction sometime this spring but is may have to wait until April as some investors try to get a jump on the sell in May phenomenon. There should be plenty of warning before such a correction. There are still some sector ETFs that look attractive for new buying.
As I noted previously there are a number of stocks that are just starting to outperform the S&P 500 and our Viper Hot Stock long positions like PCAR , TSO and EA performed well last week. Electronic Arts (EA) was up 3.5% on Friday.
If you would like specific buy and sell advice you might consider my Viper ETF Report or the Viper Hot Stocks Report . New subscribers receive five recent Trading Lessons can help you become better investors and traders. The 4-5 page ETF and Stock reports are sent out twice a week and each report is only $34.95 each per month. Subscriptions can be cancelled on line at any time.
Click here if you would like to see last Monday's Viper ETF Report
Comments
comments