

The Friday release of the latest employment data makes the upcoming earning's season the focus of most investors and traders. Though most forecasters are looking for another quarter of negative earnings I think investors are more likely to see the first quarter of earnings gains in well over a year.
Since September 9th and 12th the S&P 500 has stayed in a rather broad range as both the rallies and declines have not lasted long. The strength of the monthly market internals I discussed last week does favor higher prices at year end though October could be a tough market.
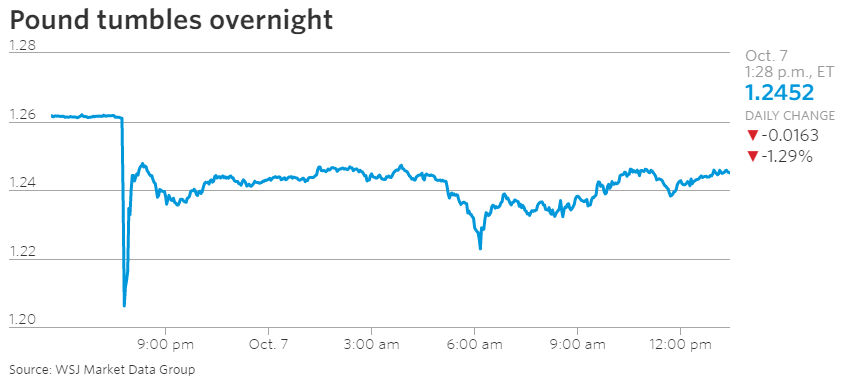
The recent scares over Deutsche Bank and the Thursday night plunge in the British Pound (see chart) have increased the fear level and reduced the appetite for stocks. There has been no heavy selling yet but it cannot be ruled out in the weeks ahead. The market internals were negative overall last week as the number of advancing stocks was not impressive even on the up days.
In election years, unlike the rest of the time, October is not a good month for stocks. According to the Stock Trader's Almanac since 1950 the S&P has averaged a 0.7% decline in election years. But since 1950 the S&P 500 in October has been higher 41 years and down 25 years with an average return of 0.80%.
In addition to the large number of bearish hedge fund managers Bank of America's Savita Subramanian expressed her negative outlook last week as they have a yearend target for the S&P 500 at 2000. Though none of her most reliable indicators are warning of a recession she is worried about complacency. It should be noted that she has often been too negative during the bull market.
Still there are several analysts that feel the odds of a bear market is low as they also feel the lack of euphoria amongst investors (What's Missing From This Bull Market?) is not characteristic of a major bull market top.
In a Bankrate article they quoted S&P's Sam Stovall "All bull markets since World War II that lasted longer than 4 years went out with a bang, not a whimper," he explains. "Investors will likely become overly confident, not cautious, before this bull comes to an end." I also find the current low level of public participation to be uncharacteristic of a bull market top.
Of course one of the primary arguments against the bull market is that stocks are two expensive. Many point to CAPE P/E formula developed by Robert Shiller that uses S&P earnings. As discussed in last week's Wall Street Journal article it is currently at 27 which was close to the reading at the 2007 market top.
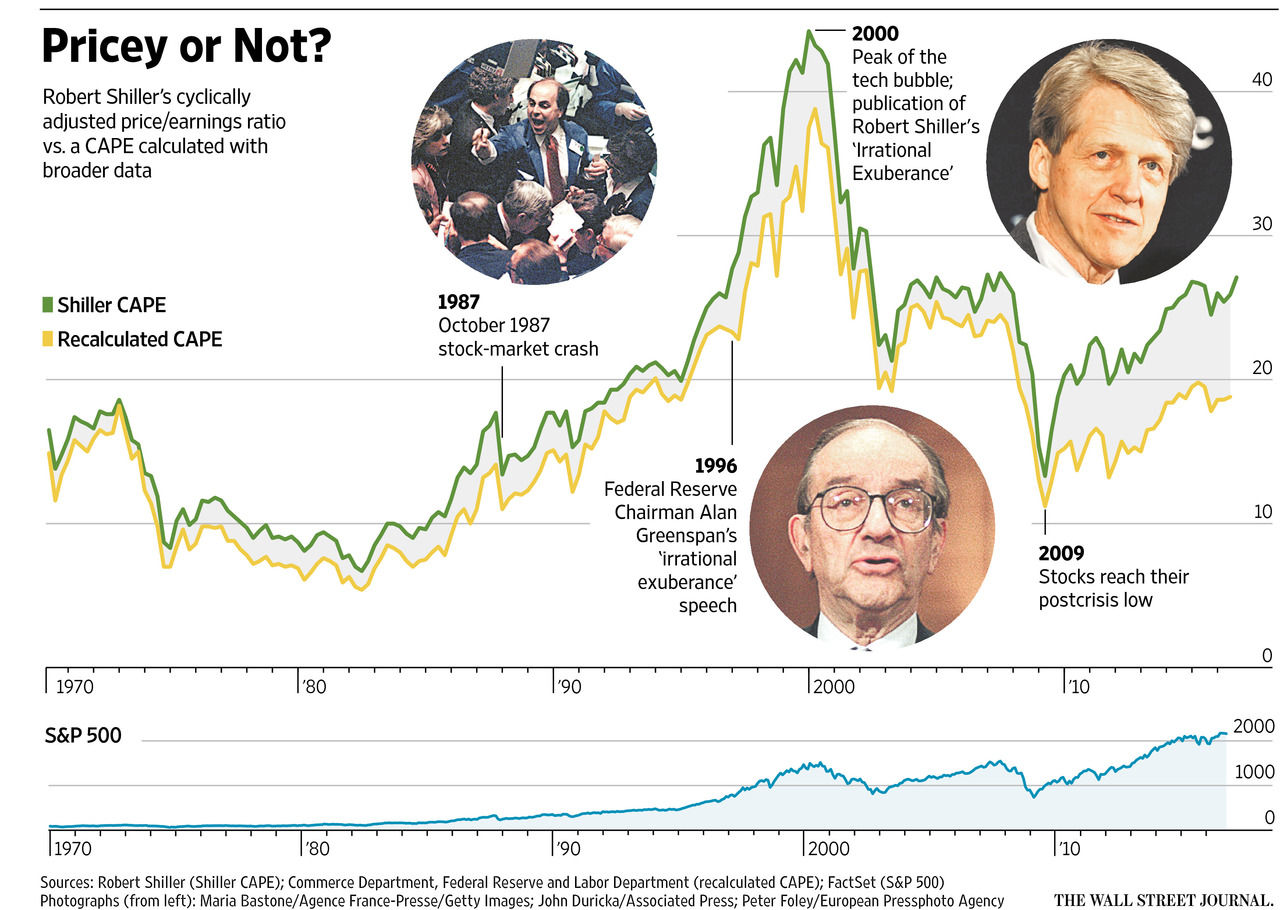
Another prominent economist Jeremy Siegel argues that accounting rule changes have lowered earnings and that the Commerce Department data gives a more accurate reading. As they pointed out " As of the end of the second quarter, according to the latest data available, the corporate-profits CAPE was at about 19—just above its 50-year average of around 17. By contrast, it was 39 at its peak during the tech bubble and 24 at the market’s peak in 2007." The chart reveals the current wide gap between the two measures of P/E which in the past have often more closely tracked each other.
It has been a crazy week for many markets including crude oil. There have been a number of bearish forecast on crude oil by well-known media analysts over the past month based on their fundamental analysis. I have always favored technical over fundamental analysis for both the stock market and crude oil. The slide in crude oil prices in 2014 from just above $100 to $55 per barrel was forecast in advance by technical studies.
In past articles I have discussed the Herrick Payoff Index (HPI) which uses volume, open interest and prices to gauge money flow in and out of a commodity. The weekly HPI on crude oil dropped decisively into negative territory on August 1st 2014 as the crude oil futures closed at $97.88. It turned positive briefly from April to July of 2015. It did not show convincing signs of a bottom until February of 2016 as crude oil dropped to $26.
In late 2014 the " The EIA (Energy Information Administration) trimmed its forecast for WTI crude oil prices to $75 per barrel in 4Q 2014 and $63 per barrel in 2015." As it turned out the futures had a high of $62.50 and a low of $34.50, closing at around $35 per barrel.
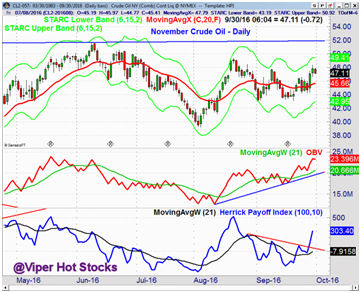
Towards the end of September there were signs that the decline in crude oil was ending. Before the open on Spetember30th I tweeted the above chart which showed that the bullish formation in the HPI had been confirmed and that a daily bottom was in place.
It should not have been surprising that November crude oil accelerated to the upside last week and closed well above $50 per barrel. The bullish readings from the weekly studies suggest that crude oil could reach the $55-$60 area which would invalidate some of the bearish forecasts.
Viper ETF favorite SPDR S&P Oil & Gas (XOP) is up 6% in the past two weeks but like crude oil may be ready for a pullback. It has been a rough few weeks for the Utilities Sector Select (XLU) as well as other interest sensitive ETFs. Many of the other sectors ETFs are still locked in trading ranges.
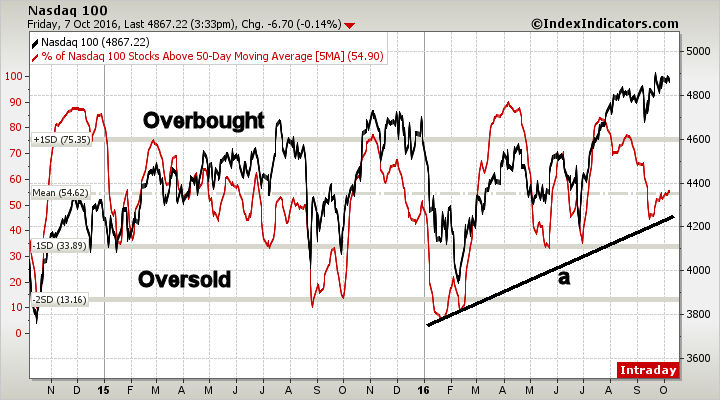
The current analysis of the % of Nasdaq 100 stocks above their 50 day MA shows that the 5 day MA is at 54.9% and is still below overbought levels above 75%. At the February lows the 5 day MA formed a bullish divergence, line a, at very oversold levels below 10%.
This analysis is also reflected in the number of stocks that show up as new buys or sells on the weekly scans that I run for the Viper Hot Stocks Reports. Two of the buy recommendations in September were CSX Corporation (CSX) and Vantiv Inc. (VNTV).
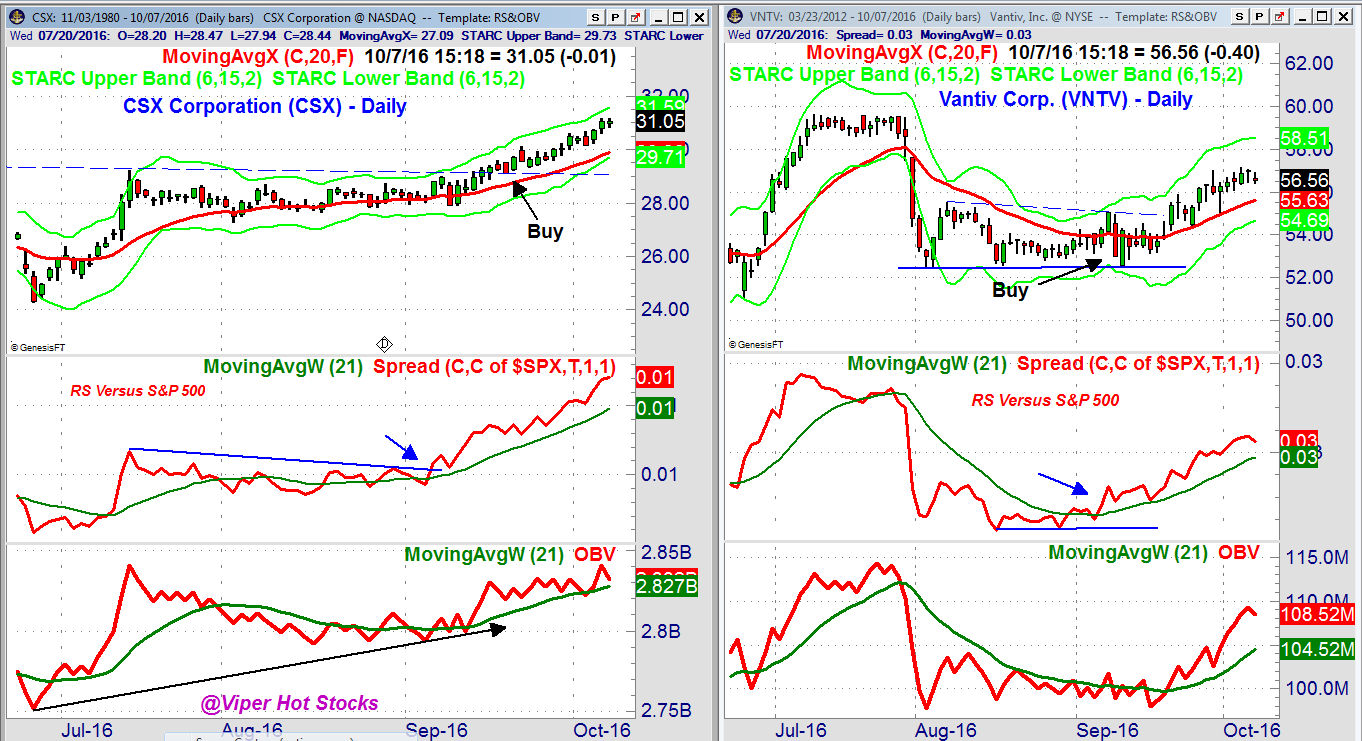
CSX Corporation (CSX) is a well-known railroad company, that had just broken out of a base on September 16th. The relative performance had already broken through its resistance, line b, over a week earlier. The OBV was also acting stronger than prices. Both of the weekly indicators had been positive since July so the bullish daily studies were a good reason to buy.
Vantic, Inc. (VNTV) is an electronic payment processing company that had corrected 11% from the July highs. The daily chart shows that prices stabilized for six weeks and then in early September the momentum changed. The daily RS completed a bullish bottom formation while the OBV indicated the worst of the selling was over. Both stocks look as though they can still move higher.
The Economy
Though the non-farm payrolls were a bit lower than expected much of the other economic data last week was better than expected. The week started off with the ISM Manufacturing Index jumping to 51.5 which was up sharply from the prior month's 49.4. The PMI Manufacturing Index was flat.
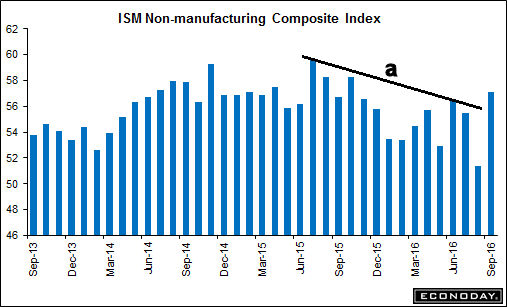
The PMI Services index also was very strong at 57.1 up from 51.4 which appears to break the downtrend, line a. This makes next month's reading even more important. The PMI Services Index also improved from 51 to 52.3 but the gain was less impressive.
Banks are closed on Monday but the markets are open with the NFIB Small Business Optimism Index on Tuesday. The big news for the week is the FOMC minutes on Wednesday followed by Import and Export Prices on Thursday.
On Friday we get the PPI, Retail Sales, Business Inventories and Consumer Sentiment.
Interest Rates & Commodities
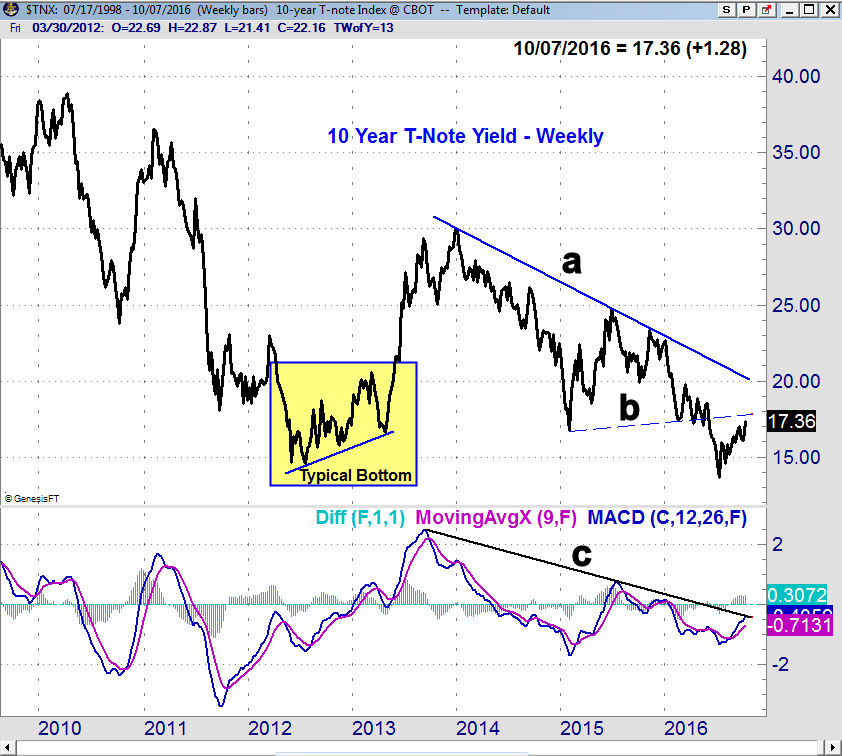
The yield on the 10-Year T-Note jumped last week to close at 1.736% as yields are now close to the resistance, line b, that goes back to early 2015. A sustained move above the 1.800% level seems unlikely until there is a pullback.
The longer-term downtrend, line a, is in the 2.000% area and several analysts are looking for a move above this key level. Once we get strong weekly and monthly buy signals a move above this level is clearly possible in 2017.
On the long-term chart I have highlighted the bottom that formed in late 2012 and early 2013. This is a typical bottom as the sharp rallies were followed by equally sharp pullbacks as part of the bottoming process.
Before yields started to accelerate to the upside in April 2013 the weekly MACD and MACD-His were both firmly in the buy mode. Now the MACDs are both rising and are now testing the long-term downtrend, line c. A strong move through this resistance is needed to indicate that an important bottom is forming.
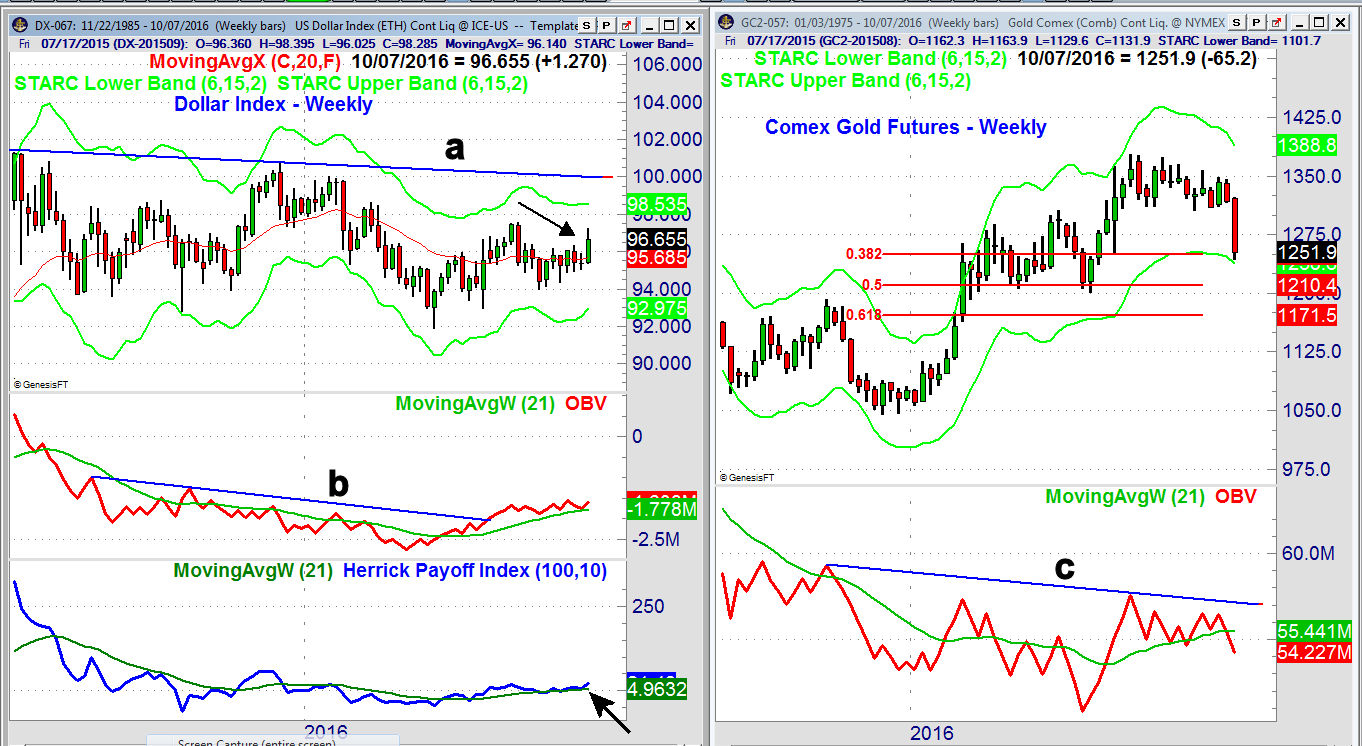
The higher yields have coincided with a sharp rally in the dollar as it triggered a weekly doji buy signal on Friday (see arrow). There is next resistance at 97.50 and the weekly starc+ band is at 98.55. The major boundary of the trading range, line a, is in the 100 area. The OBV moved through its downtrend, line b, in July and has held well above its rising WMA. The weekly HPI moved above the zero line in the middle of September.
One of the big market causalities last week was the gold market as both the metals and mining stocks were hit hard. The futures have reached the 38.3% Fibonacci support at 1251 which was calculated from the early 2016 low of 1045. Gold closed just above the weekly starc- band at 1238. The 50% retracement support stands at 1210 which is just above the June low of 1200.
The weekly OBV has dropped further below its WMA as volume was the highest of the past nine weeks. It was still below the levels seen in May and July. The monthly OBV did complete a major bottom early in the year and it is still well above its rising WMA. Our long positions in GLD and GDX were both stopped out and after an oversold rebound a further decline would not be surprising. The drop should eventually create a good buying opportunity but it will take time.
Market Wrap
The Dow Utilities dropped 3.7% last week and were by far the weakest sector as the yield on the Utilities Sector Select (XLU) is now at 3.35% almost double the yields of the 10 Year T-Note. The Russell 2000 lost 1.2% which was more than the 0.7% loss in the S&P 500 or the 0.4% drop in the Dow Industrials and Nasdaq Composite. The Dow Transports did do a bit better.
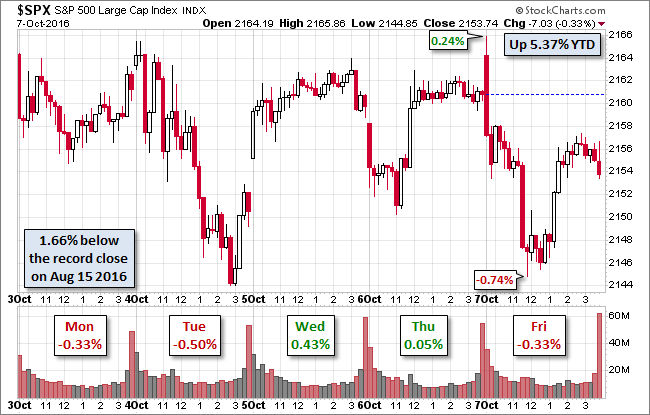
The NYSE A/D ratios were 2-1 negative and surprisingly last week the AAII bearish% dropped 9.2% to 27.9% while the bullish% rose 4.8% to 28.8%. This may have been in reaction to the better than expected ISM report as there was little action in the stock market to get one excited. The S&P 500 hourly chart from dshort shows the choppy action last week as the volume was the highest in the last hour.
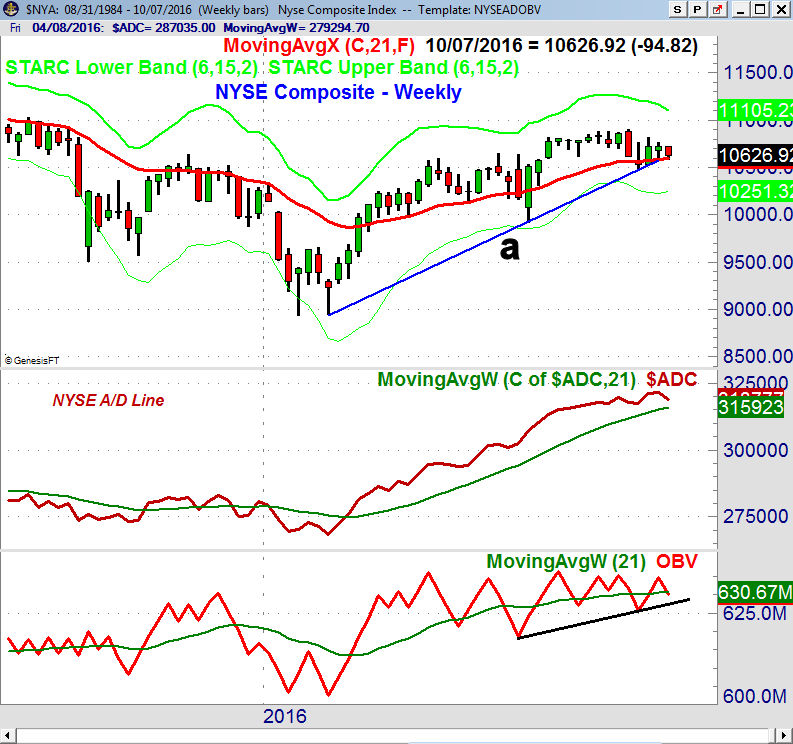
The NYSE Composite is still testing its uptrend, line a, and a close below the September low of 10,478 is likely to trigger more selling. The Friday close of 10.636 was slightly below the new quarterly pivot at 10,644. There is quarterly pivot support at 10,384 with the weekly starc- band at 10,251. The July low of 9918 represents more important support and it is 6.6% below Friday's close.
The NYSE A/D line has turned lower but is still well above its rising WMA. It would take a week or maybe two of very negative weekly A/D umbers to drop it below its WMA. It would take even longer before the weekly A/D line could complete an intermediate term top formation. The weekly OBV has dropped below its WMA but is still above the support at line b.
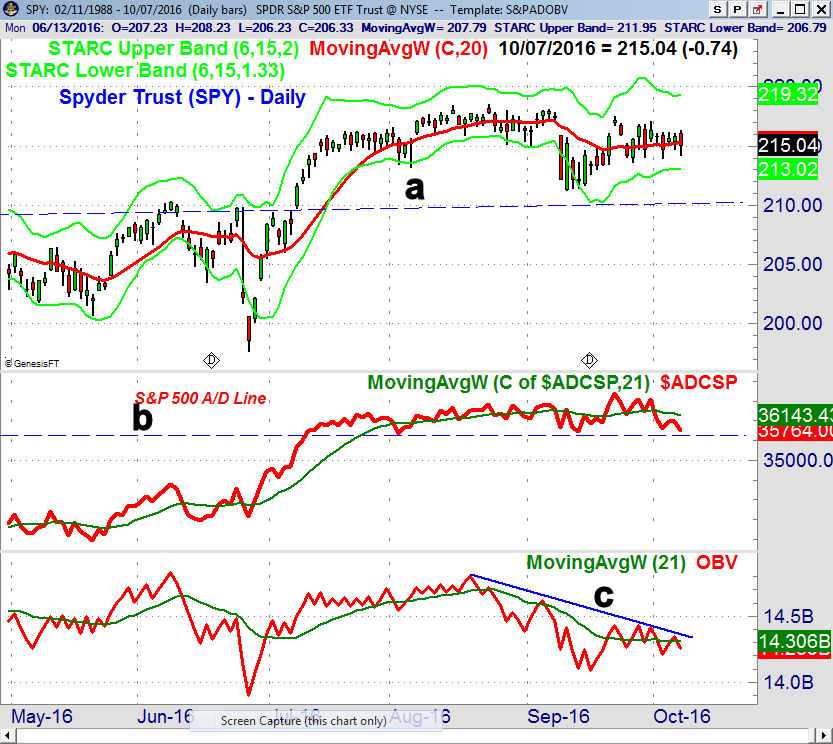
The Spyder Trust (SPY) seemed to absorb the early selling on Friday as was the case on Tuesday as it closed above the day's lows on both days. The Friday close was above the new quarterly pivot at $214.32 and traders are also now watching the support in the $213-$213.40 area. More important support in the $210 area (line a) which is 2.3% below Friday's close. If panic selling develops the support at $206-$208 could be tested.
The S&P 500 A/D line dropped back below its now slightly declining WMA last week reversing some of the positives from the new high on September 22nd. It is still above the support going back to early August at line b. A daily close below this level will confirm that the WMA is now declining and would be consistent with a further market correction. The daily OBV has reversed to the downside, line c, and has dropped below its WMA.
The weekly Nasdaq 100 and Russell 2000 A/D lines are still well above their rising WMA but the QQQ did form a doji last week so this week's close is now more important. The Dow Industrials A/D line has dropped below its still rising WMA.
What to do? The stock market's performance last week and the sharp drops in the Pound, gold and utility stocks do make the market more vulnerable over the next few weeks. Stocks needed a strong close last week with good A/D numbers to signal a new rally phase was underway but this did not happen.
A sharply lower close this week will turn the focus on the downside and a daily close in the $VIX above 15 would also be a short term negative for stocks. Alcoa (AA) releases its earnings after the close on Monday and strong earnings are the one factor that might reverse the short-term deterioration in the stock market.
For the S&P 500 the stops are likely initially under 2140 and then 2120 with the 38.2% support at 2126. The 50% support is at 2092 and then the 61.8% support is at 2068. The weekly starc- band now at 2076 was briefly exceeded earlier in the year.
The deterioration in the near term outlook does not change the overall bullish outlook for stocks going into the end of the year. This means that if there is another period of panic selling it should be a good buying opportunity.
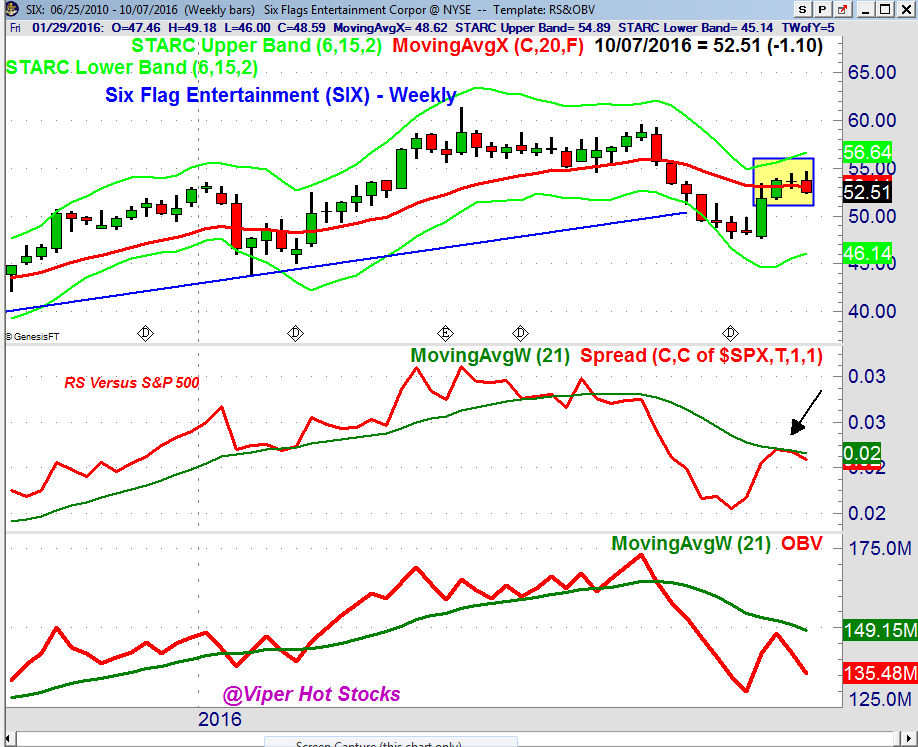
After Friday's close there more new stocks on the new sell list from my scan of the Nasdaq 100/IBD Top 50 stocks. For new recommendations on the short side Six Flag Entertainment (SIX) shows a classic setup. It was recommended to Viper Hot Stocks traders on Thursday as prices had just rallied back to the 20 week EMA and looked ready to trigger a weekly doji sell signal on Friday which it did. The RS had just rebounded back to its declining WMA and the OBV was negative. The downside targets for SIX are in the $46-$48 area.
Since this week's action could be pivotal I will be posting regular updates and charts on Twitter to keep you up to date on may market analysis.
Comments
comments