

Despite the market angst over the FOMC meeting and comments from the Big Bears since August that the stock market had to crash the major averages survived another month. Heading into the last day of the month the S&P 500 was just 2% below its all time high yet according to AAII only 24% of individual investors were bullish.
In addition to the last day of the month it is also the end of the 3rd quarter. Active managers are likely to again underperform their benchmarks for another quarter. Earlier in the year a Financial Times article revealed that "98.9 per cent of US equity funds underperformed over the past 10 years, 97 per cent of emerging market funds and 97.8 per cent of global equity funds."
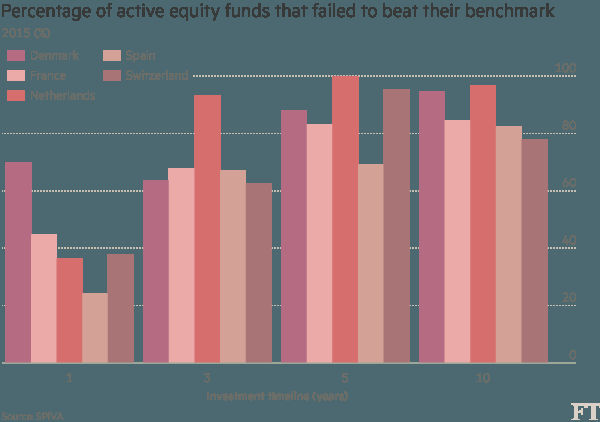
Looking at those funds sold in various Euro zone countries the message is the same as their chart indicates. Almost 100% of a actively managed equity funds sold in the Netherlands have failed to outperform their benchmarks over the past five years.
It has also likely not been an easy year for most individual investors in the US as the market plunged for the first six weeks of the year as the Spyder Trust (SPY) had a low of $178.33 on February 11th. At the time only 19.2% were bullish in the AAII survey and over 48% were bearish. From the February low the SPY is now up over 21%.
Though there were signs in February "Is There Blood In The Streets Yet?" from a number of technical studies that the worst of the selling was over but still each month there was something else for investors to worry about. This was the proverbial "Wall of Worry" that is often the focus of the headline driven financial media that in my view does a good job of keeping investors out of the market.
The recent trend of weak earnings seasons has been used each quarter as a reason stocks can't go higher and if it is a slow news week the TV media trots out those perennial bears who warn of a market bubble. In April I pointed out "Why Bubble Fears Are Bullish For Stocks" and each month I have tried to debunk the latest additions to the wall of worry.
It has clearly been a year of wide market swings as evidenced by the post Brexit vote drop as well the 400-point plunge on September 9th. After the February lows it was the continued improvement of the A/D line in March that provided further evidence that the intermediate trend was positive.
On April 1st the S&P 500 A/D line moved above the 2015 highs which provided a strong signal that the stock market's next major move would be higher, not lower. At the end of May there was another significant technical development as the monthly NYSE A/D line closed well above the monthly high from 2015 (line d). It has always been a very good indicator of the market's health. At the end of May 2003 the A/D line moved to a new high signaling that the bear market from the 2000 high was clearly over.
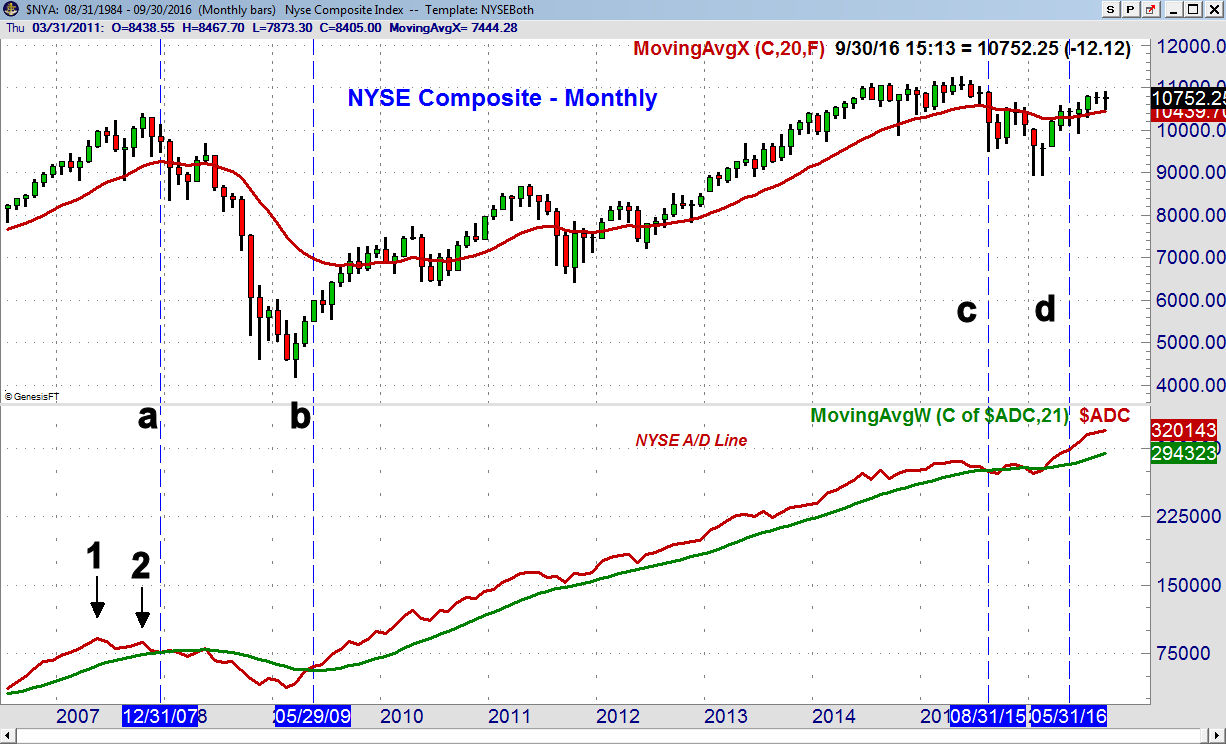
The monthly A/D line peaked in May 2007 (point 1) and at the October 2007 highs it formed lower highs, point 2. The weekly and daily A/D lines also formed negative divergences which confirmed a bull market top. The monthly A/D line dropped below its WMA in December 2007 (line a) and did not crossed back above its WMA until May 2009.
By the end of 2009 the A/D line had surpassed the 2007 high confirming a new bull market. The ability of the monthly and weekly A/D lines in make new highs in 2010 through 2015 was a clear sign the bull market was still intact despite all of the market commentary to the contrary.
The monthly A/D line peaked in May 2015 and dropped below its WMA at the end of August, flipped above it in October and then back below it in January 2016. This is why the subsequent move to new all time highs last spring was so significant.
So what does this mean for the last quarter of the year? The monthly NYSE A/D line is still well above its WMAs. It is important that the WMA is still clearly rising and it would take several months before it could violate the WMA. (For more see the Market Wrap section)
The fact that the S&P 500 has been higher in every quarter of 2016 further increases the odds of a positive close in the 4th quarter. According to a CNBC article "of the 19 years in which the market rose in the first, second and third quarters, a negative fourth quarter only followed five times." This adds to the overall positive trend for the 4th quarter as stocks were positive 73% of the time.
For investors I have stressed that you should focus on the longer-term data and use the quarterly pivots for weekly trend analysis. Each week and month I review the technical studies as well as the relationship of the Friday close of the ETFs or stocks to their quarterly pivot. Those that close above their quarterly pivot have a positive intermediate term trend.
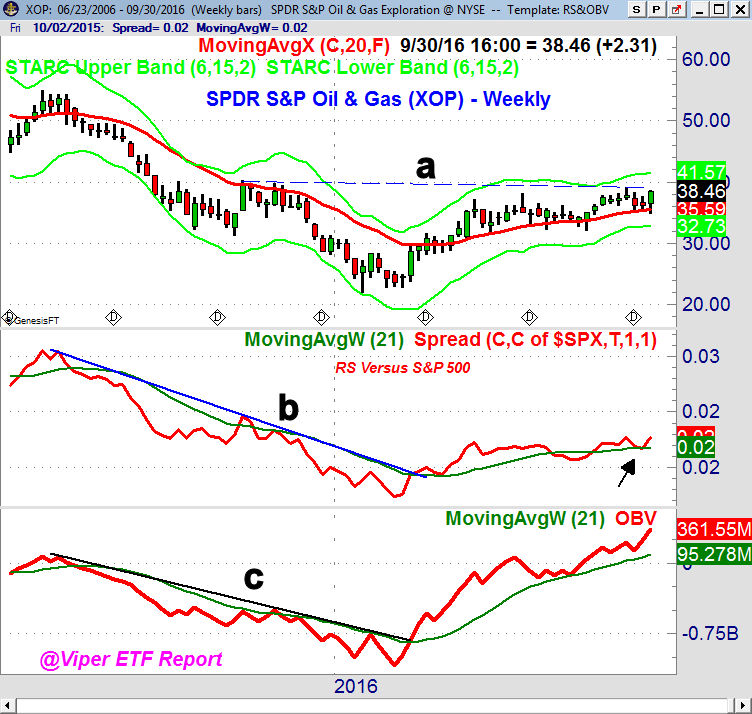
The SPDR S&P Oil & Gas (XOP) has been a favorite of the Viper ETF Report for most of the year as there have been several profitable swings. The weekly relative performance broke its downtrend, line b, in early March and just bounced off its WMA. The OBV turned positive at the same time breaking its downtrend (line c). It has stayed above its WMA ever since.
The OBV made a new high last week and XOP has been above its quarterly pivot since the start of the 2nd quarter. Additional long positions were added on the recent pullback and a close above $40.44 will give much higher targets. The Herrick Payoff Index (HPI) on crude oil completed its bottom on Thursday as I Tweeted a chart on Friday. The recent students of the HPI class have appreciated how it has helped trade the swings in XOP.
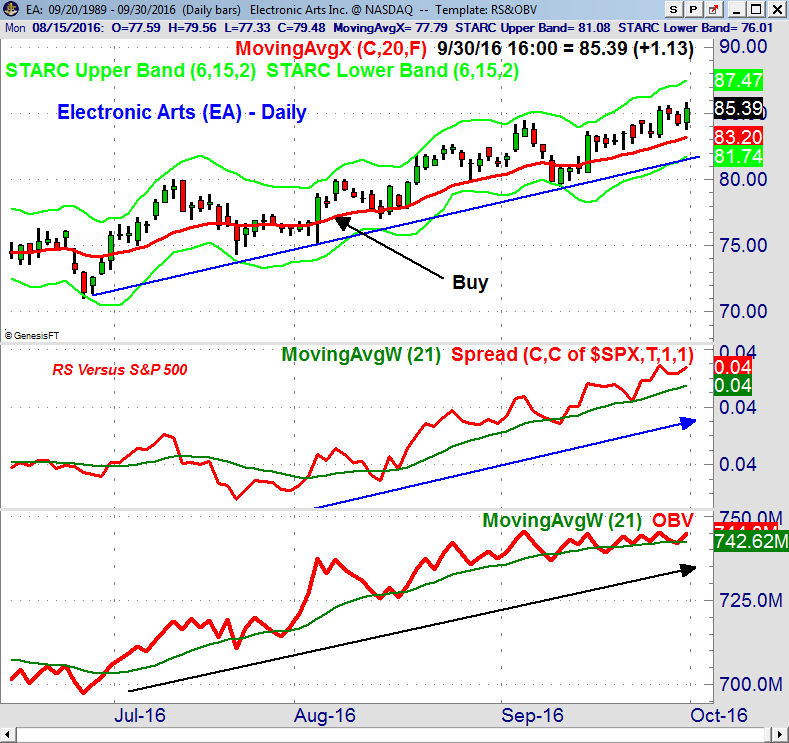
Even thought the averages have seen some wide swings there have been a number of stocks that have been steadily outperforming the S&P 500. Once that showed up in the weekly scan for Viper Hot Stocks in early August was Electronic Arts (EA). It gained another 1.3% on Friday and the daily RS as well as the on-balance-volume (OBV) show very positive daily as well as weekly trends.
Though many advise avoiding stocks because of their high P/E or too high market averages there continue to be a number of stocks that have just completed their bottom formation. In the over 150 stocks that I scan for my Monday stock recommendations I look for stocks that are either in solid weekly up trends that have corrected back to support or have completed weekly bottom formations. These are also the methods that I teach in my individual training sessions. (If you are interested email us at wentworthresearch@gmail.com)
The Economy
Though there was plenty of economic data last week but stock market seemed to pay little attention as traders were focused on the macro issues they felt were driving prices higher. The final 2nd quarter GDP came in as expected but Thursday's market decline was fueled over concerns about the viability of Deutsche Bank AG.
The focus this week will be on the monthly jobs report which means another round of debate on what the Fed may do on rates. The manufacturing data was better than expected last week as the Dallas Fed Manufacturing Survey and Friday's Chicago PMI were both better than expected. This week we have the ISM and PMI Manufacturing indices on Monday.
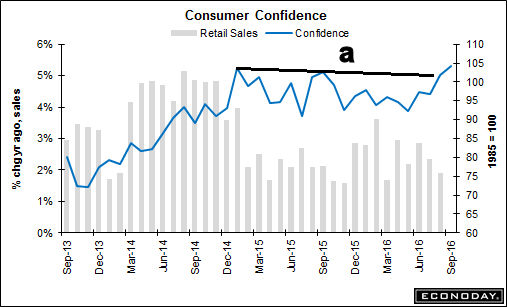
The stock market did seem encouraged by last Tuesday's Consumer Confidence which was strong at 104.1 much better than the consensus estimate of 98.8. As the chart shows this reading has exceeded the 2013 highs, line a, and caused a breakout on the charts. Friday's Consumer Sentiment was a bit better that expected and the last half of the month bodes well for October.
On the housing front New Home Sales were down from August but there were some positive signs as Econoday concluded that "This is a very positive report which underscores the accelerating strength of the new home market." Pending Home Sales were weak and the S&P Corelogic Case-Shillar Housing Price Index was flat.
This Wednesday we get new data on the services sector with the PMI Services and ISM Non-Manufacturing Index. Both were weaker than expected last month so they are likely to be examined more closely this week.
Market Wrap
Few were expecting the S&P 500 to gain 3.5% and the Nasdaq Composite 9.7% in the 3rd quarter. The outlook of most analysts and traders at the start of the quarter was not that positive. For the week the Dow Transports led the way, gaining 1.8% as the iShares Dow Transportation (IYT) has been recently favored on the long side by the Viper ETF Report. The A/D numbers for the week were slightly negative with 1487 stocks advancing and 1638 declining. More stocks did make new weekly highs which is a plus.
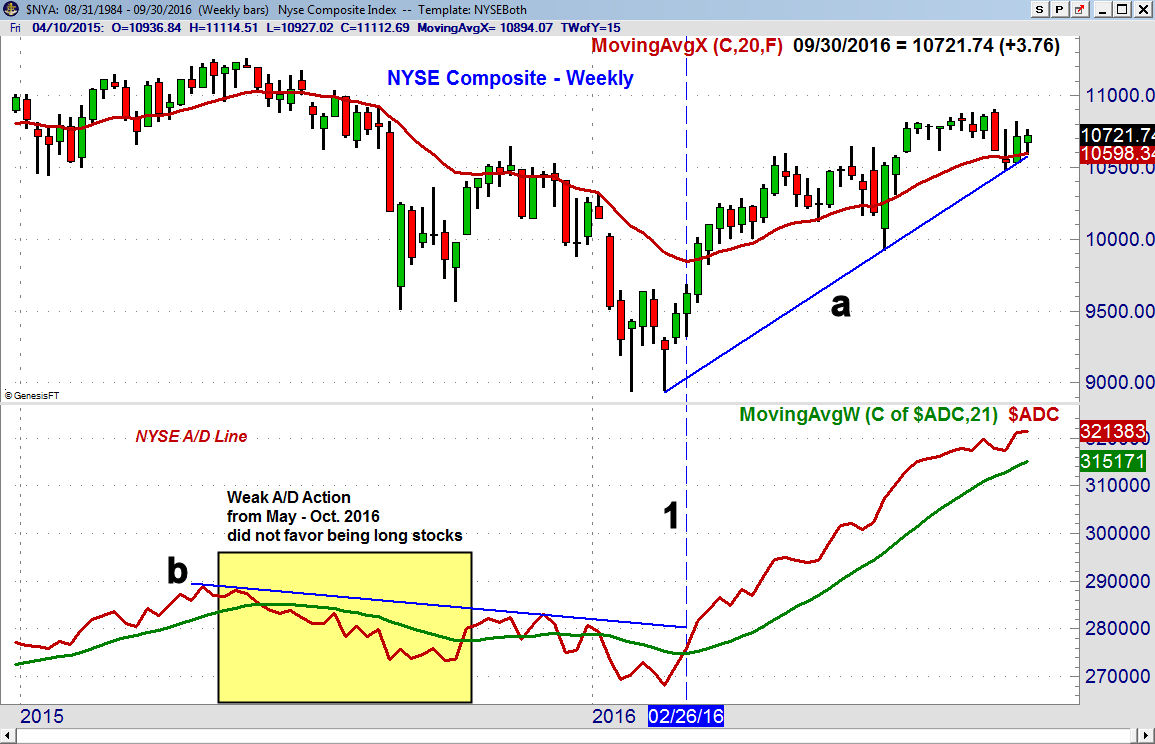
In 2015 the weekly A/D line formed a negative divergence in May, line b, and then dropped below its WMA in June. This weakness kept me from buying stocks and as I pointed out in early July "Greece Isn't The Real Problem" it was the weak technical outlook not the concerns over Greece's debt that investors should focus on. Stocks finally collapsed in August.
On February 26th (line 1) the weekly A/D line moved above its WMA and one week later it overcame the bearish divergence resistance at line b. In 2015 it was eight weeks after the April high that the NYSE A/D finally dropped below its WMA. This would require several consecutive weeks of very negative A/D ratios.
The NYSE composite has been testing its weekly support at line a. A weekly close above 10,818 will project a move above 11,000 with additional targets in the 11,200-500 area. For the new quarter the pivot stands at 10,644 and a weekly close below 10,487 would be a sign of weakness.
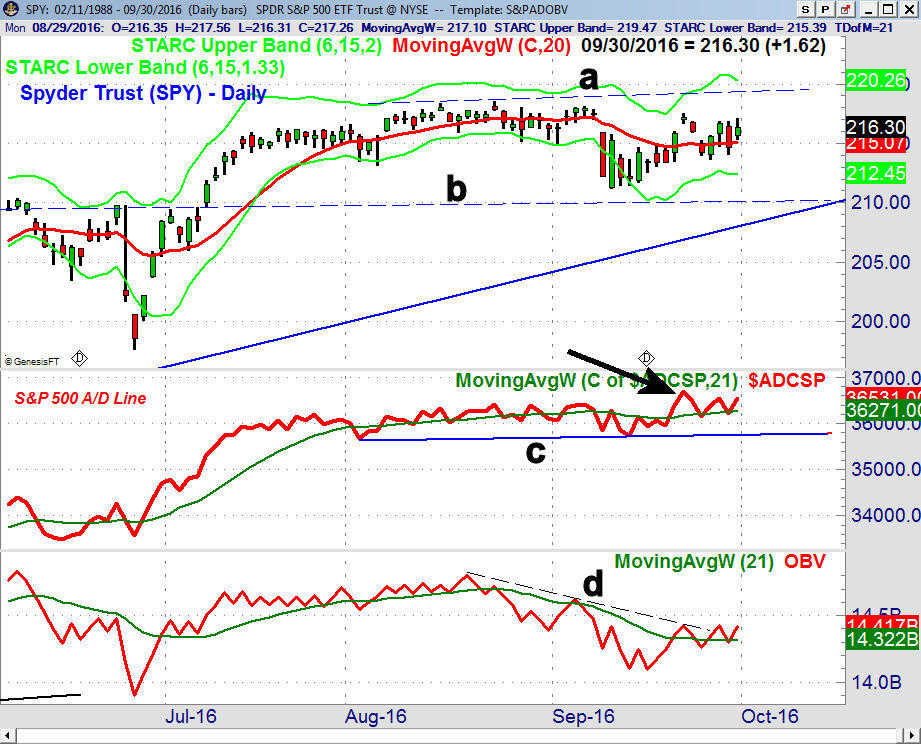
The Spyder Trust (SPY) did manage to close the week higher despite selling early in the week. As I commented in Monday's five-page report to clients "the market's internal strength indicates additional weakness early this week should be followed by higher prices". The upside reversal late Tuesday and strong close Wednesday suggested the pullback as over as SPY held the support in the $213-$214 area.
The sharp drop last Thursday clouded the short term outlook as SPY now needs a close above $217.53 to signal a test of the $220 area, line a. The completion of the trading range (lines a and b) has upside targets in the $223-$225 area.
The S&P 500 A/D line made a new high on September 22nd and is holding above its WMA. It has important support at line c. The daily OBV is trying to break its downtrend as it has been acting weaker than prices while the weekly is acting stronger.
The Powershares QQQ Trust (QQQ) and the iShares Russell 2000 (IWM) have the strongest relative performance and should lead the S&P 500 higher.
What to do? My analysis still suggests the mid-September breakout of the trading ranges in the A/D lines does favor a further market rally as we start off the new quarter. Even though the outlook for stocks doing in the end of the year remains positive you should be prepared for more sharp down days.
Alcoa (AA) releases its earnings on October 10th and I still expect the earnings season to be much better than expected. With a stock market that is already in a positive trend good earnings should be supportive. As I mentioned last time I still like the technology, biotech and small cap stocks.
Once the A/D lines start another strong rally phase I will likely look to some of the leveraged long ETFs for Viper ETF traders as they are already long the IWM and QQQ as well as other ETFs.
After Friday's close there are 24 Nasdaq 100/IBD Top 50 stocks that have generated new buy signals and just 10 with new sell signals. There are also some new weekly doji buy and sell signals. For each of these stocks I look at the monthly, weekly and daily charts to find new recommendations for Viper Hot Stocks traders on Monday.
Comments
comments