

The summer ended with a long list of big name investors who shared their dire forecasts for the global stock markets. Some were looking for a 10-15% correction but others were looking for much more. Individual investors were also skeptical about the stock market as according to AAII just 23.6% were bullish on November 3rd while over 42% were neutral.
In last Thursday's survey 46.65% are now bullish while the neutral camp has dropped to 26.77%. The bearish % is at 26.6% as it has only dropped 8% from before the election. The bullish % reading is the highest since February 19th 2015.
According to AAII "There isn't a clear trend as to how the market has performed following unusually large two-week increases in bullish sentiment. The median six-month gain for the 13 periods when there was a larger two-week increase in optimism was 5.9%. Though above the historical median for all periods, the number is skewed upwards by a 34.5% gain following the two-week, 26.1 percentage-point increase in optimism on March 19, 2009."
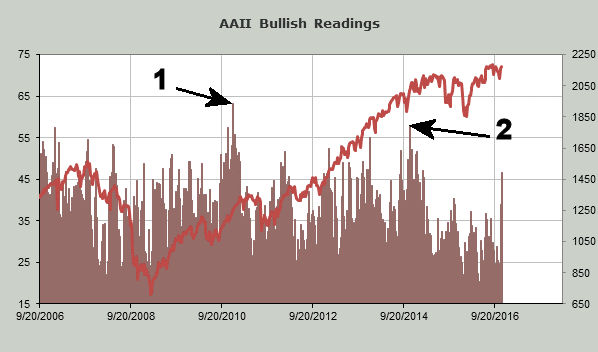
The bullish % is still well below extreme levels as the highest reading during this bull market was 63.3% on December 23, 2010 (point 1). The S&P 500 did see a 6% drop in February and then peaked in May which was a 9% gain from the December 23rd close.
As the chart indicates the bullish % rose to 57.9% on November 13, 2014 (point 2) and then the S&P 500 continued to grind higher until May of 2015 as it gained 4.5%. In my experience a high reading in the bullish % is not a sell signal as the market rally can continue for some time.
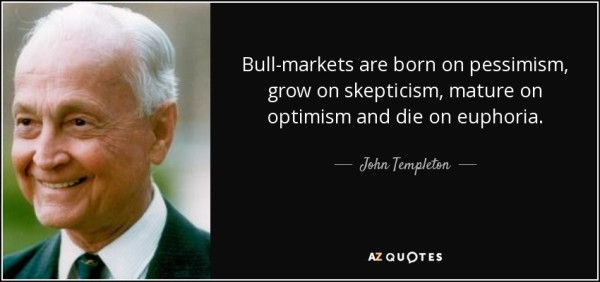
Maybe this is the start of the stock market's euphoric stage that is typically the last stage of a bull market as was pointed out in the famous quote from John Templeton . I commented in August (What's Missing From This Bull Market?) that historically major tops such as those in 1929 and 2000 have been accompanied by more investor participation and euphoria.
The public participation in the stock market is still quite low which is also not normal for a bull market top. Maybe this is starting to change as $44.6 billion has moved into equity ETFs since the election. A good part of the funding has likely come from the bond market as the dramatic rise in yield and drop in prices has panicked many investors. Barron's reported that the 4% decline in Bloomberg Barclays Global Aggregate Index was "the biggest two-week loss in more than a quarter-century."
It has been a tough eight days for those trying to buy the index tracking ETFs or the financial sectors as there has been little in the way of a pullback to buy. I think that those who jumped into the market late last week may have to take some heat as I think there will be a better risk entry point in the weeks ahead.
I place considerable emphasis on the entry price for all ETF or stock positions as I discussed in a recent article "Finding The Best Entry Levels". I have found that too many investors and traders get caught up in the emotion of the market especially when it is moving relentlessly higher and therefore they end up buying too high. Then when the market corrects they are often stopped out before the overall uptrend resumes.
I found that a combination of the relative performance and the on-balance-volume (OBV) can do a superior job of alerting investors to those ETFs or stocks have the best profit potential when the risk is still manageable. In early October when the SPDR KVW Regional Banking Index (KRE) was recommended to both investors and traders the risk on the position was 4.8%.
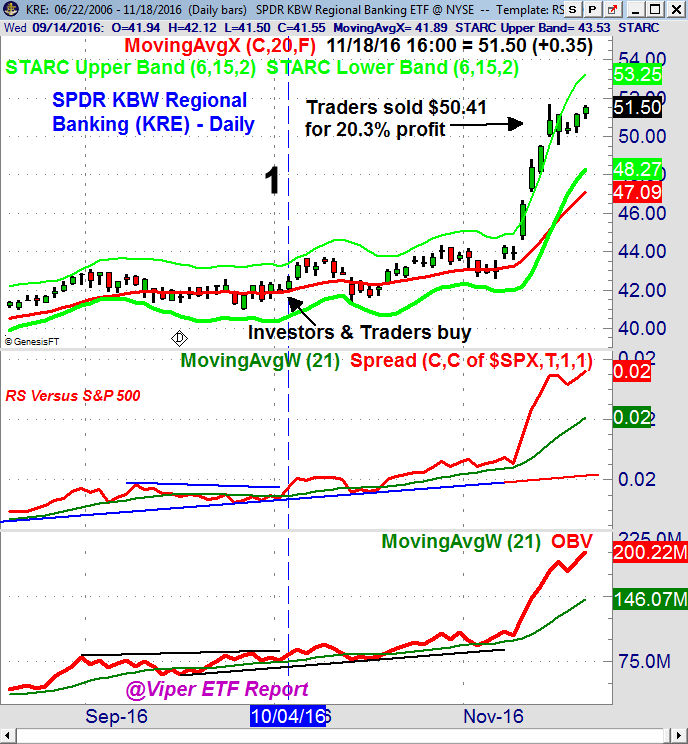
This Viper ETF recommendation was based on the positive weekly studies and the daily studies (line 1) had also just turned positive. KRE had closed the prior day at $42.27 and my buy level at $41.90 which was hit the next day.
I recommended that traders sell their position last Monday as KRE had closed well above its daily star+ band. It had also closed the prior week above its weekly starc+ band which indicated it was now in a high-risk buy area.
On Friday it closed at $51.50 which was above my exit price for traders but investors are still long. The starc bands help me decide whether to buy, sell or hold. This does not mean that KRE cannot still move higher but it does indicate that the inevitable correction may be very sharp.
In last week's chart of the E-Mini S&P futures I pointed out that the overnight drop in the futures on the market's surprise reaction to a Trump victory took the futures below the weekly starc- band. This is a fairly rare occurrence and indicated that at the lows the S&P futures were in a high-risk sell but a low risk buy area.
These bands are interpreted totally differently than the Bollinger Bands. When a market has rallied up to the daily starc+ band after completing a technical bottom they tell me to wait for a few days as the market is likely to either consolidate or correct. Often in a sustained uptrend prices will not reach the weekly starc+ band for some time which makes it more likely that I will hold onto a position as long as the technical studies stay positive.
By looking at the monthly, weekly and daily starc bands you can often identify important price extremes. In August and September 2011 gold futures closed above the weekly starc+ bands for two consecutive months and it had also exceeded the weekly starc+ bands for three weeks in August. The gold futures peaked at 1923 in early September which was the start of a multi-year decline.
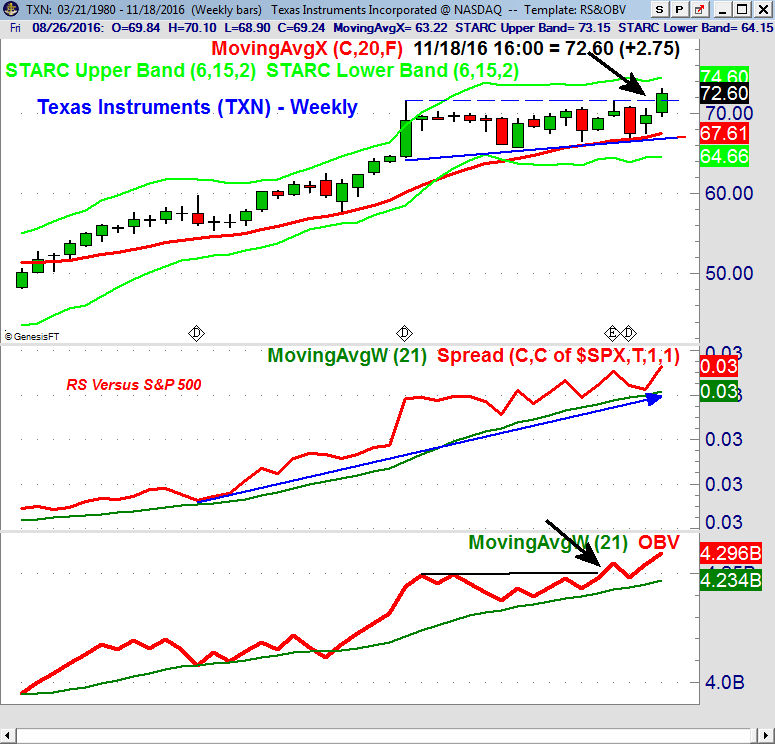
There is still a number of industry group and sector ETFs that have just bottomed or they are in the process of bottoming so there are still ETF opportunities. There are also a number of stocks that look attractive. Texas Instruments (TXN) is a Viper Hot Stocks pick that just broke out of its weekly trading range (see arrow) with Friday's close. The weekly RS and OBV stayed positive as TXN moved sideways and then the OBV broke out to the upside a few weeks ago.
The Economy
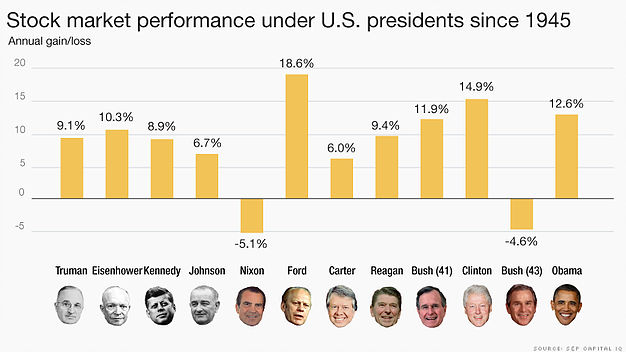
The stock market rally has been fueled by hopes of what they think President Trump will do to make the economy get even stronger. This interesting chart from S&P Capital IQ shows what the stock market has done under various president s going back to Truman. On this table the performance under President Ford is likely to be the biggest surprise to many.
The economic data last week suggested that the economy was already getting stronger. The Empire State Manufacturing Survey, Philadelphia Fed Business Outlook Survey and even the Kansas City Fed Manufacturing Index are suggesting continued improvement in manufacturing. This trend needs to continue over the next few months.
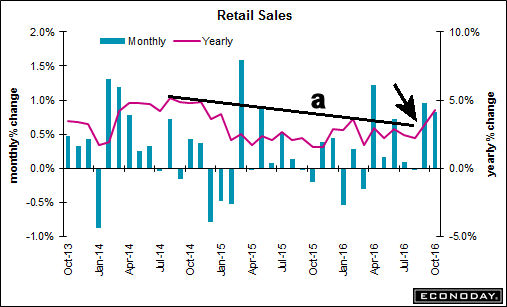
The Retail Sales came in at 0.8% and September was revised up to 1.0%. The yearly rate has broken its two year downtrend, line a, which is a positive sign. Thursday's Housing Starts report indicated a 25.5% surge which was the best reading since August 2007.
Friday's report on the index of leading economic indicators (LEI) showed a modest 0.1% gain. But more importantly it is still in a positive trend and as I have pointed out in the past it has a good record of topping out well ahead of the start of a recession.
There is a fair amount of economic data in this holiday-shortened week with the Chicago Fed National Activity Index on Monday followed on Tuesday by the Richmond Fed Manufacturing Index and Existing Home Sales. The Durable Good Orders Wednesday are followed by the flash PMI Manufacturing Index, New Home Sales and Consumer Sentiment.
The markets are closed on Thanksgiving and will close early on Friday when we get the flash reading on PMI Services.
Interest Rates & Commodities
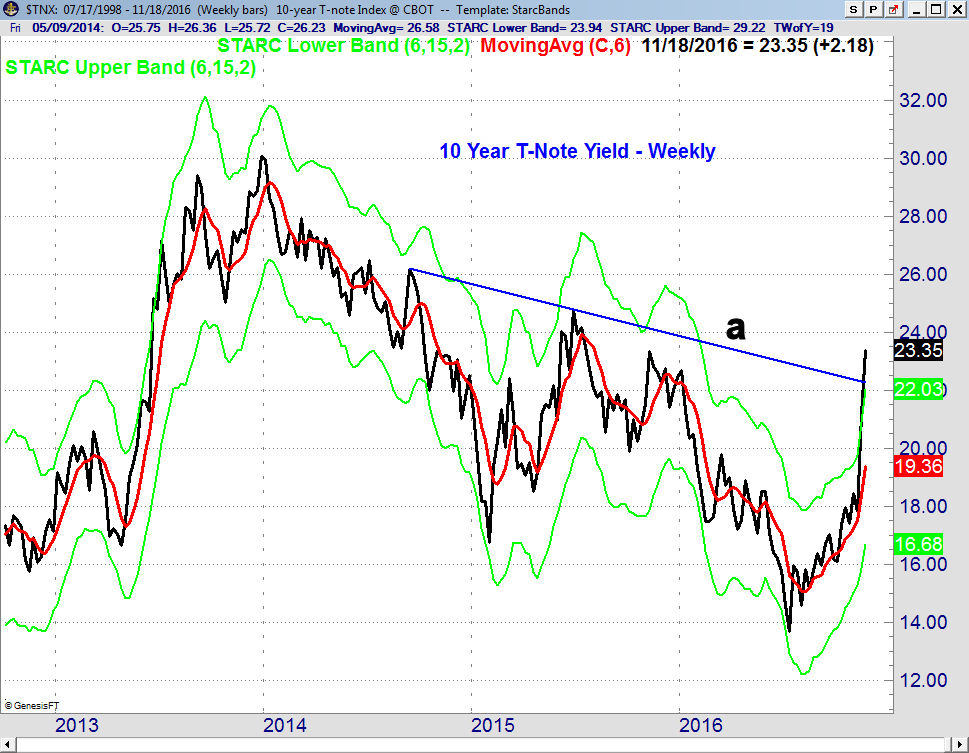
The yield on the 10 Year T-Note continued to surge last week rising from 2.117% to close at 2.335% as the downtrend from the 2014 and 2015 highs, line a, has been broken. The next resistance is at 2.489% which was the 2015 high and then in the 2.600% area.
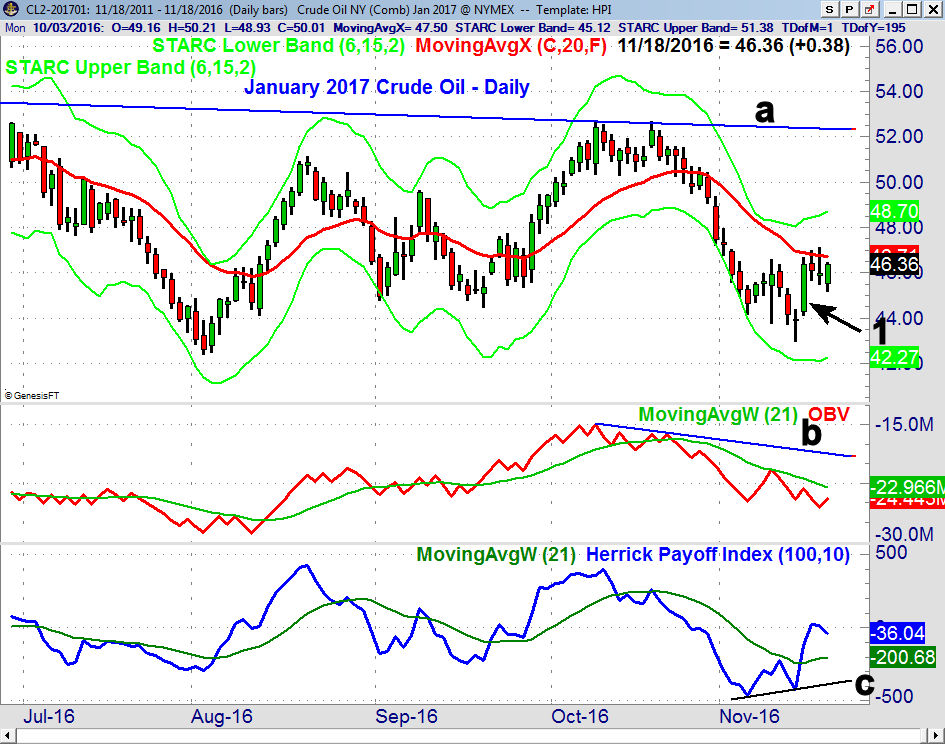
The January Crude Oil contract triggered a daily doji buy signal on Tuesday (point 1) but so far it has not been able to close well above the 20 day EMA at $46.71. There is good support now at $44-$44.50 and then at the doji low of $42.95. The daily OBV is still below its WMA and has formed slightly lower lows. The HPI has formed a bullish divergence, line c, which is consistent with a market bottom. The HPI could correct still back to its WMA one more time as part of the bottoming process.
Market Wrap
The small cap stock and Dow Transports led the market higher again last week as the Russell 2000 was up 2.6% and the Dow Transports gained 3.2%. The Dow Industrials were up just 0.1% while the S&P 500 had a 0.80 % gain. The Nasdaq Composite was up 1.6% as it made a marginal new high on Friday.
The weekly market internals were positive with 1982 stocks advancing and 1149 declining. The telecommunication stocks led the market gaining 3%, followed by a 2.2% gain in the oil & gas stocks and just under 2% in both consumer services and financials.
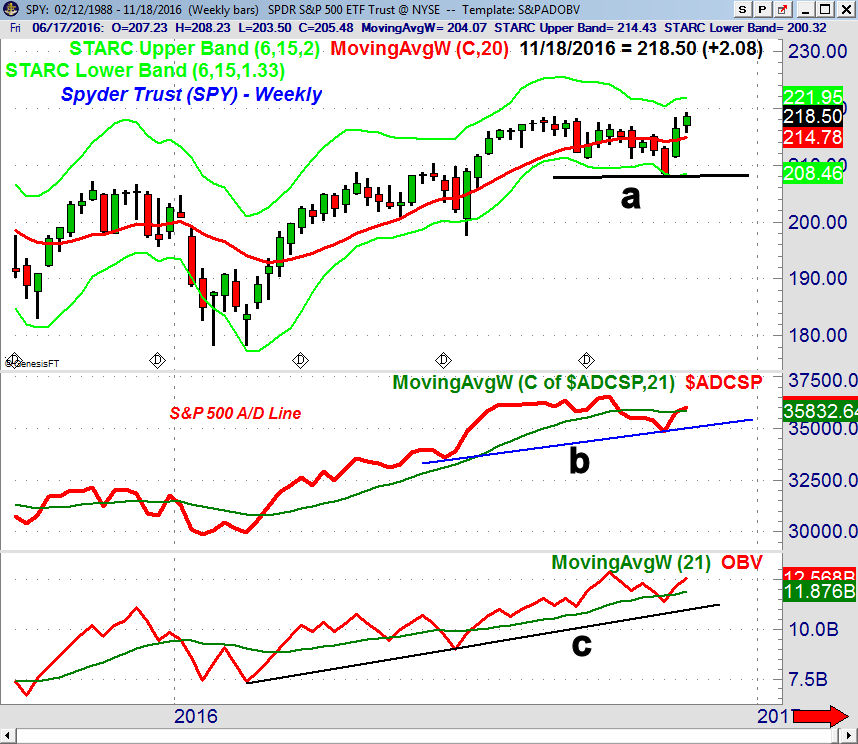
The Spyder Trust (SPY) is very close to making a new all time high but it does look likely in the next few weeks. The daily starc+ band and quarterly pivot resistance stands at $222.06. The 20-day EMA is rising strongly but is well below the market at $215.40. The daily starc- band is now at $213.90 and it was tested on four consecutive days just before the election. The support at $208.38, line a, is now the key level to watch.
The weekly S&P 500 A/D line has moved above its WMA but is still well below the September high. It needs much stronger A/D numbers to confirm a new market high. The divergence will not be a problem as long as the A/D support at line b, is not broken. The weekly on-balance-volume (OBV) has moved above its WMA but has not yet made new highs.
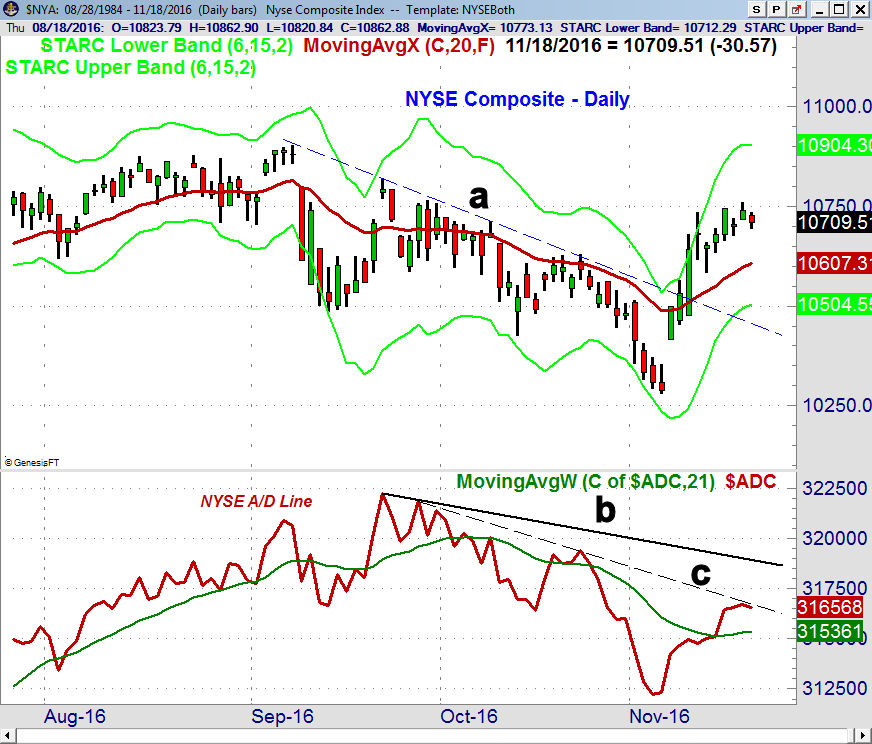
The NYSE Composite has been lagging the other major averages but has now broken its downtrend, line a. It is still well below the September highs and the resistance at 10,800-900. The rising 20 day EMA at 10,607 now represents good support.
The daily and weekly NYSE A/D lines are the weakest of those that I follow. The short-term downtrend, line c, was tested last week but has not been overcome. The WMA is trying to turn higher but the A/D line needs to surpass the important resistance at line b, to confirm that the correction is over.
There were signs last week that the decline in the tech sector was over so I recommended that Viper ETFs traders add to their longs in the PowerShares QQQ Trust (QQQ) and to buy the Technology Sector Select (XLK) near Monday's lows.
The Nasdaq 100 A/D line did break its near term downtrend last week suggesting that the worst of the correction is over. A near term pullback is still possible this week. A strong move in the QQQ above $118.40 is needed to confirm that the correction is over.
The Russell 2000 A/D line is still rising sharply and is now very close to confirming the new all time highs. It is overdue for a pullback which may come in the holiday-shortened week when the volume is light.
What to do? Plunging bond prices and soaring stocks dominated the action again last week but a near term reversal is still likely in the next week or two. It should present a buying opportunity but the starc band analysis does not favor buying the strong market sectors at current levels.
This is now becoming a more popular view but trading during Thanksgiving week is often quite choppy so it is definitely not a time to make an emotional trades. I suggest you consider incorporating the starc bands into your analysis as they will help you determine whether to buy, sell or hold.
The A/D lines on the SPY, QQQ and IWM have all moved out of the corrective mode but those on the NYSE and DIA have not. Though there are no signs of trouble from the strong daily A/D lines but the lagging action of the weekly A/D lines does require close monitoring in the weeks ahead.
The Dow Industrials do look a bit more vulnerable on a pullback as DIA formed a doji last week at the weekly starc+ band. This could provide an opportunity for short-term traders. For Viper ETF clients I am looking for a rotation into those sectors which have not rallied like the financial stocks since the election.
This could be a better week for stock traders as Viper Hot Stock traders have several open buy orders in stocks that need a low volume pullback in order to reach buying levels where the risk can be better managed.
If you are interested in my market analysis during the week and want specific recommendation you might consider one of my services. Each is only $34.95 per month and includes regular trading lessons along with the twice a week reports. New subscribers also receive four of the most recent trading lesson and subscriptions can be cancelled anytime on line.
Because of the holiday there will just be a Market Wrap section next weekend.
Comments
comments