

The buyers appeared to have dried up by last Friday's open as after ten positive closes in the Dow Industrials the market became nervous ahead of President Trump's DC speech. The stock market had traded lower several times last week but each day it has rebounded by the close. That was again the case on Friday as the Dow Industrials and S&P 500 closed higher.
The data from AAII on the individual investors revealed that the bullish % rose 5.4% last week to 38.5%. The change was due to those moving out of the neutral camp . It had peaked on November 24th at 49.9% and hit a low of 31.6% on January 26th.
I have been following these numbers for decades and have always emphasized that they have to be fiiltered by the analysis of the market internals in order to identify important market bottoms. I have found the data to be less reliable in identifying market tops.
Extremely low bullish readings can be quite accurate in identifying high levels of market fear as they identify periods where more investors are thinking about selling than buying stocks. For example, during the summer of 2010 the market was correcting and the bullish % dropped to a low of 20.7% on August 26th. The daily NYSE A/D line then moved to a new high on September 12th which indicated the correction was over.
There were also lows in 2011, 2013, 2014 and 2015 where bullish sentiment was quite low and the A/D lines indicated that it was a buying opportunity. Of course the most recent extreme low in bullish sentiment occurred in January and February of 2016.
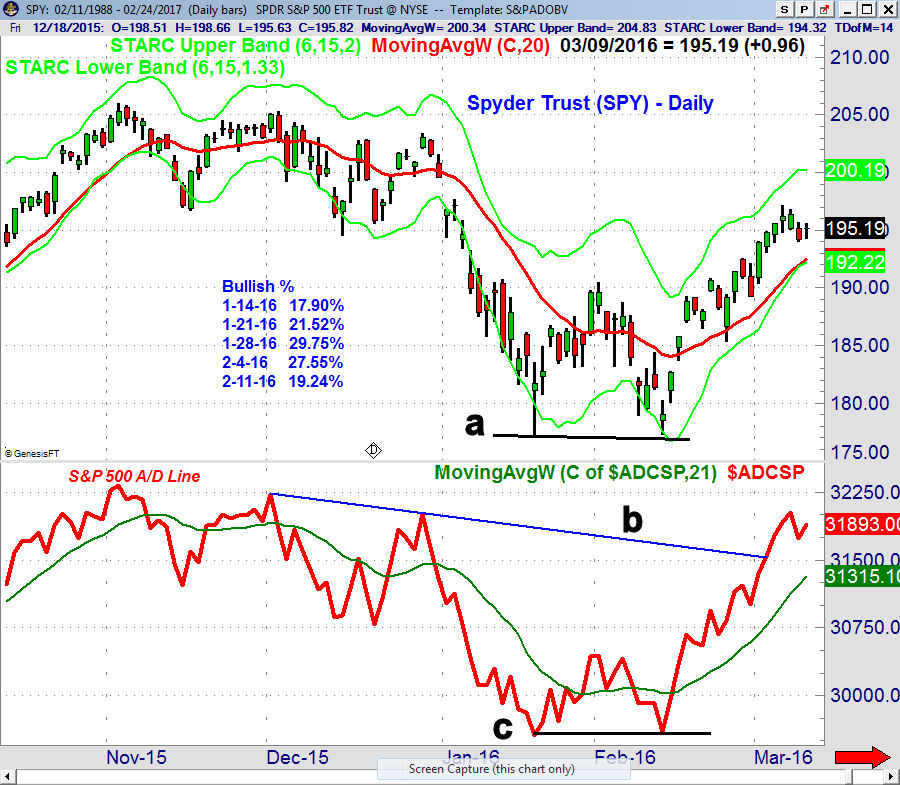
The insert on the chart shows that on January 14 the bullish % was at 17.9% which was the lowest reading since 2005. The bullish % dropped back to 19.24% on February 11th as the Spyder Trust (SPY) dropped slightly below the January low, line a.
In contrast that low was accompanied by a higher low in the S&P 500 A/D line (line c). This bullish divergence was confirmed by a similar divergence in the McClellan oscillator and H/L data as I noted in my February 13th column. Two weeks later the weekly A/D lines turned positive by moving above their WMAs.
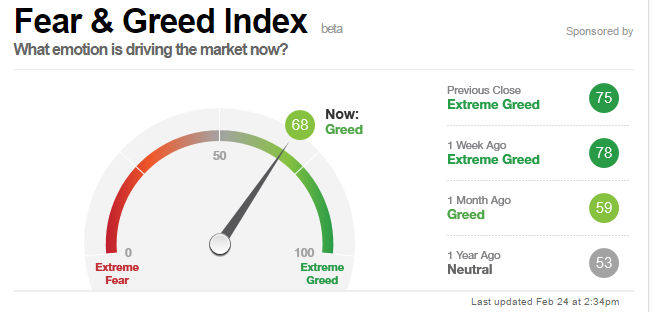
Many investors like to follow CNN's Fear & Greed Index. I have found this index to be much better at identifying high levels of Fear (market bottoms) than at market tops. This is due in part that when two of its components, stock price breadth and stock price strength, are very high my experience is that it indicates a positive trending market not a top.
High levels of these indicators are not necessarily bearish unless they start to diverge from prices and then turn lower. It should be noted that stock price breadth does not track the actual A/D data as it looks at the advancing and declining volume.
Put and Call option data is a contrary indicator as when too many are buying puts it is a sign that too many are bearish on stocks. Conversely during a prolonged period where the call buying is much higher than the put buying it can be a negative for the market and does indicate a high level of greed. It is the change in their trends that generally indicates a market turn.
Given these caveats it can still be useful indicator for investors to follow as long as it is viewed with regard to the current analysis of the various A/D lines. I follow these A/D lines: NYSE, S&P 500 A/D, Nasdaq 100 and Russell 2000 but do not find the Nasdaq Composite A/D line to be that valuable.
In January and February of 2016 the Index completed a double bottom below 20 before it turned sharply higher. For investors the drops below the 20 level, that coincide with positive or bottoming action in the A/D lines, are often the best buying opportunities.
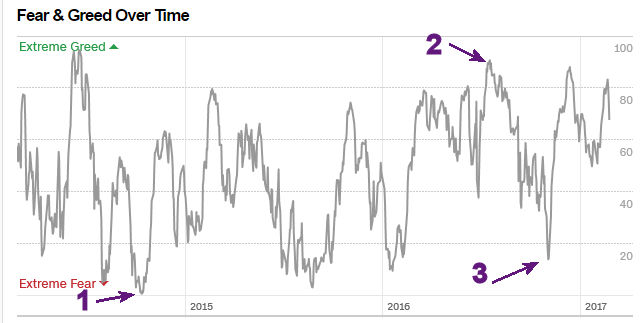
During panic selloffs, like that which occurred in August of 2014, the Fear & Greed Index can get very low as it dropped to 4 (point 1) which was down from a month earlier reading of 68. In the middle of a strong rally one has to be careful about not missing good buying opportunities because of high levels in the index.
When I wrote last year's June 18th column ("The Week Ahead: Is The Fear Trade Your Best Bet Now?") the Index was well in Greed territory at 75 but the more important bullish % had dropped back to 25.4%. Te recent major breakout in the A/D lines had me urging investors not to be frightened out of the stock market because of the upcoming Brexit vote as the high Index level was a sign of strength.
Specifically I concluded that "There no signs on the horizon that we are on the verge of starting a new recession so even if there is a sharper correction than I am expecting I still expect stock prices to be higher by the end of the year. The previously recommended ETF buying zones for Viper ETF clients have been reached but were selected with a clear focus on the risk. Longer term investors should continue to favor positions in low cost, broadly based ETFs or mutual funds."
The daily new highs in the major averages have caused an interruption in the large number of bearish articles from many of the perennial bears that dominated the commentary prior to the recent market surge. As I suggested last spring please research any author you are not familiar with as many of these bears have been negative for many years.
Over the near term the hibernating bears are likely a short-term negative as it will eventually lead to a market correction that will clear the air. Such a pullback should create a buying opportunity. Since the market leading PowerShares QQQ Trust (QQQ) had reached my upside targets from December the Viper ETF traders took partial profits a week ago.
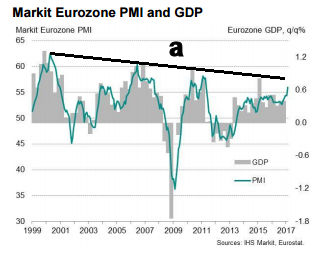
The continued improvement in both the inflation outlook and the economy in the Euro zone is another strong signal that these markets should be considered on a pullback. The Markit Eurozone Purchasing Managers Index has turned sharply higher and may be able to break through the downtrend that goes back to 1999.
The Economy
Last Tuesday's flash PMI Manufacturing Index held firm in the latest report at 54.3 which was only down slightly from the prior reading at 55.1. The Existing Home Sales were very strong and well above expectations.
The Chicago Fed National Activity Index was a bit lower than expected as production was weak. In contrast the Kansas City Fed Manufacturing Index was better than the most forecasted. The always-volatile New Home Sales were lower than expected on Friday while Consumer Sentiment at 96.3 held firm.
This week we have Durable Goods, Pending Home Sales and the Dallas Fed Manufacturing Survey on Monday. This is followed by a full slate on Tuesday with GDP, the S&P Corelogic Case-Shillar HPI, Chicago PMI and Consumer Confidence.
This is followed Wednesday by the PMI Manufacturing Index, ISM Manufacturing Index and Construction Spending with the ISM Non-Manufacturing Index on Friday.
Interest Rates & Commodities
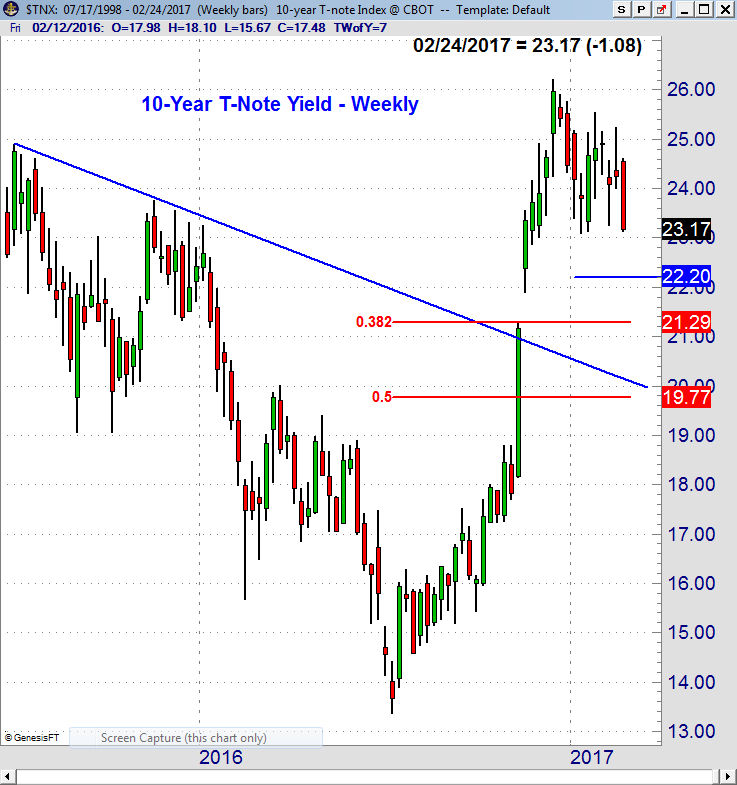
The yield on the 10-Year T-Note dropped sharply last week to close at the lowest level since the middle of November. This may be an important week for bonds as further selling will indicate that yields can drop to the yearly pivot support at 2.220%. If this level is broken the major 38.2% Fibonacci support is at 2.129%. A weekly close above 2.555% is needed to signal higher yields.
Crude oil had a choppy week but ended slightly higher. The early bounce on Tuesday did not generate any follow through to the upside which is a reason for concern. Both the weekly and daily OBV and HPI are positive but do not yet show any signs yet of upward acceleration.
Market Wrap
It was another week of solid gains with only the Dow Transports and Russell 2000 closing the week lower. The Dow Industrials were up 0.96% while the S&P closed 0.69% higher. The Dow Utilities were up 4.07% as the relative performance confirmed the recent Viper ETF buy in Utilities Sector Select (XLU).
The market internals were positive and were slightly stronger than the previous week as 1763 stocks advanced and 1334 stocks declined. There were 133 NYSE stocks making new highs with just 16 making new lows.
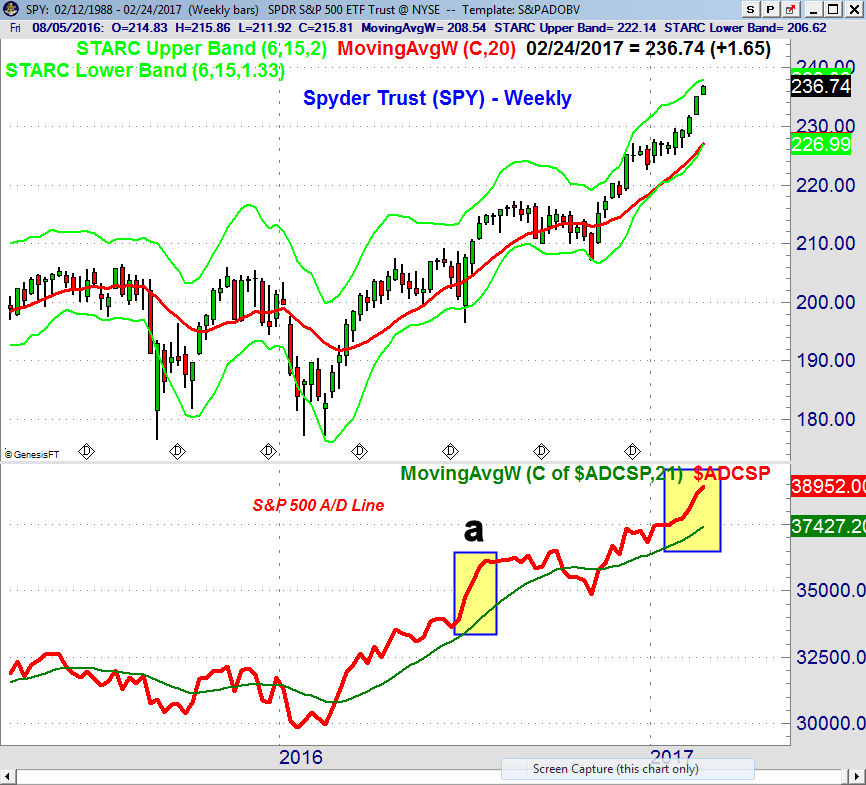
The weekly chart of the Spyder Trust (SPY) shows that it gapped higher last week and closed strong. The weekly starc+ band rose to $238.03 last week as SPY is getting closer to the quarterly pivot resistance at $240.04. The 20 week EMA is at $227.03 and is now rising more sharply. This is a sign that any correction over the next few weeks will not be a sign of a major top.
The weekly S&P 500 A/D is also rising even more strongly and looks similar to what occurred from the middle of June through late July of 2016. Last summer after several strong weeks the SPY advance narrowed for a number of weeks before there was a sharp correction.
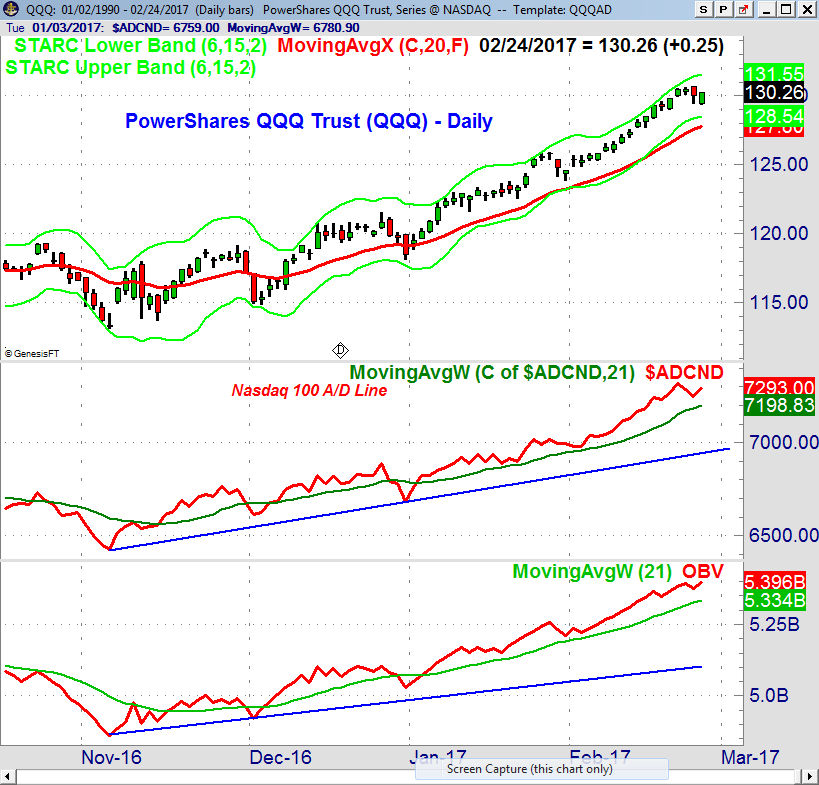
The PowerShares QQQ Trust (QQQ) after testing the daily starc+ band consolidated before Friday's higher close that may mean that the pullback is over. The daily starc+ band is now at $131.55 with the weekly at $132.30. The QQQ did form a doji last week. The daily starc- band is now at $128.54 with the 20 day EMA at $127.80.
The Nasdaq 100 A/D line made a new high on Tuesday and turned up on Friday. The A/D is still well above its rising WMA and shows no signs of a top. The OBV is also bullish as it continues to make new highs with prices.
The iShares Russell 2000 (IWM) was lower last week as it closed on the 20 day EMA and retested the breakout level. The weekly relative performance is now below its flat WMA and a strong weekly close is needed to signal it is becoming a market leader. The Russell 2000 A/D line is the only one that has not yet made new highs.
What to do? The shallow pullback last week may be the only correction we will see before the major averages move even higher. As I discussed last week March and April are often two of the best months for sector ETFs but with a heavy economic calendar this week a correction still cannot be ruled out.
In my trading lesson on market corrections the daily A/D analysis would take several weeks before it will warn on a meaningful correction. It is likely to take even longer before the weekly A/D lines could turn negative.
For those who have not moved into the stock market over the past year this is not the time to take a large new position in the market. Some light buying would be fine but there should be a period when the fear is higher in the next few months to do more aggressive buying.
The Viper ETF clients are long both the market tracking as well as some of the sector ETFs but we continue to recommend that traders take partial profits on strength.
For stock traders I am still favoring the long side in the Viper Hot Stocks Report as there are a number of stocks that are still in the process of bottoming.
New subscribers to either service receive five recent Trading Lessons that can help you become a better investors or traders. The 4-5 page ETF and Stock reports are sent out twice a week and each report is only $34.95 each per month. Subscriptions can be cancelled on line at any time.
Comments
comments