

It has been a choppy week in the stock market as after Monday's sharply rally stocks grinded lower before turning higher on Friday. Even though the stock market has failed to break to the downside this week, most but not all of the daily studies still indicate that the market is still in a corrective mode.
This was based on my analysis of the A/D data which has done an excellent job of keeping me on the right side of the market for many years. This analysis is detailed in the Market Wrap section of each Week Ahead column so you can follow along to see what signs I am looking for to change my outlook. The daily signals have to be viewed in the context of the weekly analysis as when both are negative it can signal a more severe market decline. That was the case last summer and early this year.
This A/D analysis allows me to rate the market outlook as positive, neutral or negative. When the market is in the positive mode the market leading ETFs and stocks can easily record double-digit gains in 4-6 weeks as was the case after the February lows. Investors following the Viper ETF Report closed out longs in the Materials Sector Select (XLB) last week for over a 17% profit.
The correction warnings of course can just be a sign that the market is merely consolidating or undergoing sector rotation. The regular monitoring of the A/D lines can then alert the analyst when the market has resumed its major trend.
Much was made last week of the news that one of Berkshire Hathaway's managers had invested $1 billion in Apple (AAPL). Coincidentally AAPL did show up on last Monday's Viper Hot Stocks buy list before the Berkshire news hit the tape.
Many investors and traders at one time in their careers have taken a position in a market because that is what the "big money " was buying or selling. A new position established by a high profile investor, hedge fund or money manager is often reported by the press or in an SEC filing.
As I noted in a recent article on the hedge fund bubble the stocks they favor generally do worse than the major averages. Since last October I have commented that I could not understand how a mutual fund or hedge fund could justify such a grossly overweight position in Valeant Pharmaceuticals International (VRX).
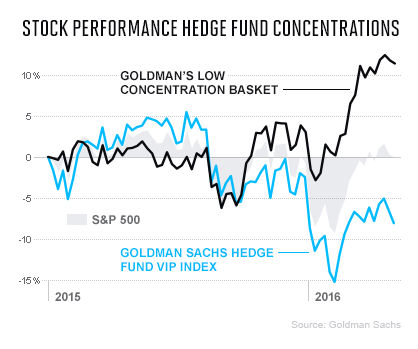
From a recent Fortune article this chart shows how much better those stocks that have a low concentration in hedge funds have performed then those that are widely favored by the hedge funds. If a widely held stock starts to drop then the hedge funds often try to get out at the same. For example in the first six weeks of 2016 those stocks most favored by hedge funds, measured by the GS Hedge Fund VIP Basket, dropped 5% more than the an equal weighted index of the S&P 500.
This data was further supported by an article in the weeked WSJ which reported that buying those stocks favored by hedge funds only gives one a very small edge which is not meaningful when transaction costs are included. The very short-term traders can often briefly capitalize on the news but they do not stay long.
Many can also be tempted to follow the hedge funds in the commodity markets. Over the past month there have been many bullish forecasts and recommendations on the gold market. As I pointed out again last week the technical studies suggested that gold was topping out.
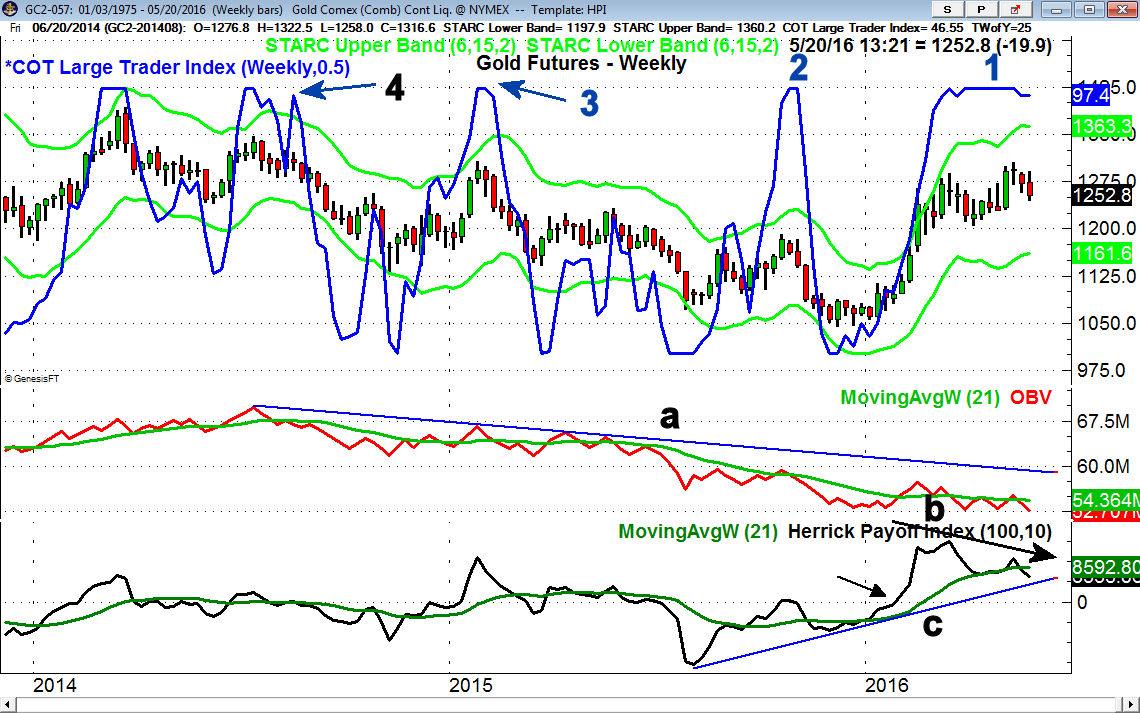
Last week the gold futures closed below the prior week's doji low triggering a sell signal. The futures look ready to close the week down $20. Even though the gold futures have risen from $1050 to over $1300 the on-balance-volume (OBV) has been unable to move above the peak from early in the year and has stayed below the longer-term downtrend, line a.
The Herrick Payoff Index (HPI) uses volume and open interest to measure the flow in or out of a commodity. At the end of January the HPI moved above the zero line indicating that the money flow was now positive. The HPI rallied strongly for the next eight weeks as gold rallied over $170 per ounce. Even though gold has moved higher the HPI formed a negative divergence, line b. A drop in the HPI below support at line c, will be more negative.
Another reason I was not enthusiastic about buying gold was based on the Commitment of Traders report. It is released each Friday by the CFTC which shows the long and short positions in the major commodity markets. If you are interested in the COT data it is free from the CFTC. Also I just discovered a new site that appears to have nice charts on the COT data (http://freecotdata.com/) that you might want to look at though I have not fully analyzed their reports.
The COT Large Trader Index from Trade Navigator shows when these large traders are overly long or short. Since March 11th the large traders or managed money have been predominantly long gold as the Index has been close to 100 (point 1). It may take a drop back below $1200 before the large traders sell out their long positions. A similar peak occurred in the latter part of October 2015, point 2, just before gold dropped $50.
In January 2015, point 3, the Index reached a similar extreme when gold was above $1300 and it subsequently plunged well over $200 in the next six months. The twin peaks in 2014, point 4, also preceded a sharp drop.
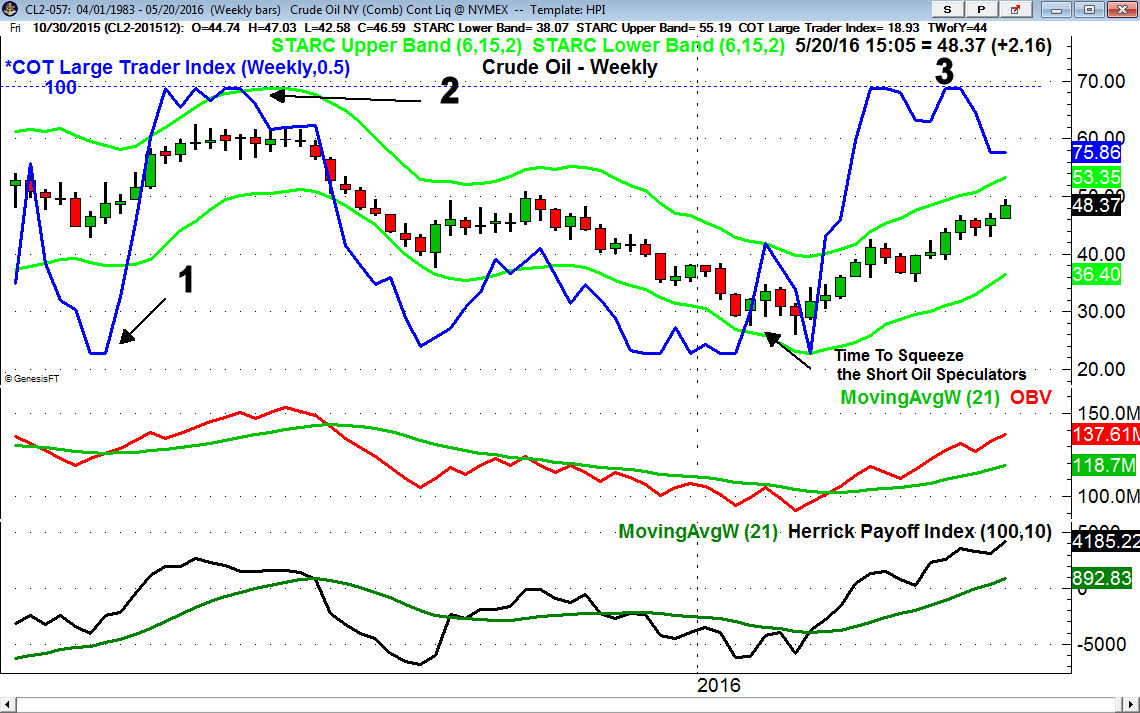
Of course a high level of long or short position can continue for some time so it is important that one use technical analysis in conjunction with the COT data. In March 2015 the large traders were heavily short crude oil (point 1) which correlated with positive technical signals as both the OBV and HPI had moved above their WMAs.
Crude oil rallied for eight weeks and then started to move sideways as the Large Trader Index reached 100. As I noted in the Week Ahead column last June this sideways action was negative and by early July the weekly technical studies had turned negative. Crude oil subsequently dropped from $75 to $26 a barrel in early 2016.
In the January 22nd article "Time To Squeeze The Short Oil Speculators?" there were signs that the shorts were starting to cover. The Large Trader Index rose from 0 to 50 for a few days before it again turned lower. This was a precursor to the bottom as the weekly HPI moved strongly above its WMA on February 19th even though the Index was at zero as the smart money was short.
By the middle of March the smart money was on the long side with the Index back to 100 (point 3). The Index has dropped back to 75 but there are no strong signs yet from the weekly studies that oil has topped out. Therefore if you are considering a position in a stock, commodity or ETF that is a favorite of the smart money please do your own research before you take a position.
The Economy
The manufacturing data was generally weak last month as Monday's Empire State Manufacturing Index dropped to -9 while most were expected a +7 reading. The Philadelphia Fed Business Index was also weaker than expected as new orders contracted. The Chicago Fed National Activity Index was only a bit better than expected but Tuesday's Industrial Production jumped to 0.7% which was higher than expected.
The data for the housing market was quite good with the Housing Market Index at 58 is showing solid optimism by the builders. The Housing Starts were also strong and Friday's Existing Home Sales indicated low, but steady improvement.
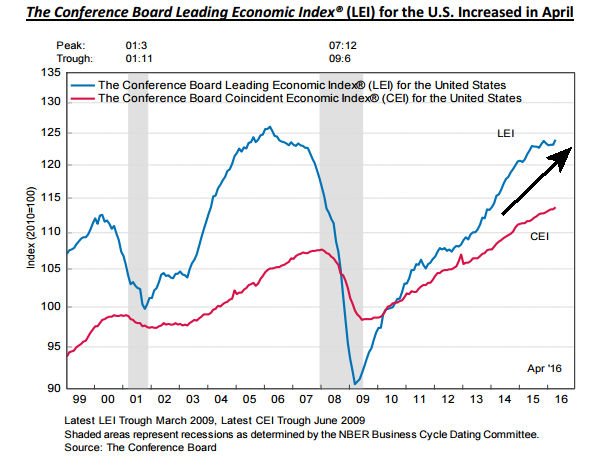
The all-important Leading Economic Indicators increased to 0.6% which was a sign that April was a good month for economic data. The chart shows that the LEI has clearly turned up as this was first positive month since last November. As I have mentioned in the past, this indicator has a good record of topping out well ahead of a recession so April's data is a very good sign for the economy.
This week we have the flash PMI Manufacturing Index on Monday followed on Tuesday by the New Home Sales and the Richmond Fed Manufacturing Index. On Thursday we get the Durable Goods, Pending Home Sales and the Kansas City Fed Manufacturing Index. This is followed on Friday by the preliminary reading on 1st quarter GDP and the month end reading on Consumer Sentiment.
The FOMC minutes last week raised the possibility that the Fed could raise rates in June but I continue to think this is unlikely. Even though the Fed Funds futures now show a 30% chance in June and a 55% chance in July. Yields rose during the week to a high of 1.882% but then settled back on Friday. They are still locked in a trading range.
Market Wrap
Even though stocks gave up a good part of their gains on Friday the S&P 500 was up 0.3% for its first gain in four weeks while the Dow Industrials closed down a fraction. The action in some of the other averages was more impressive as the Dow Transports were up 2.2% while the Nasdaq Composite gained 1.1%. The weekly advance/decline ratio was slightly negative.
Half of the major sectors were higher last week led by technology's gain of 1.8% and a 1.5% rise in the oil & gas stocks, health care, financials and materials were also higher for the week. The other five sectors were lower as the utilities lost 2.3% while consumer services dropped 1.7% for the week.
According to AAII the individual investors have become even more skeptical about the stock market as the bullish% reading dropped further to 19.3%. Over the past 29 years it has only been below the 20% level 30 times. The VIX is still at very low levels as it has failed to break out on several attempts.
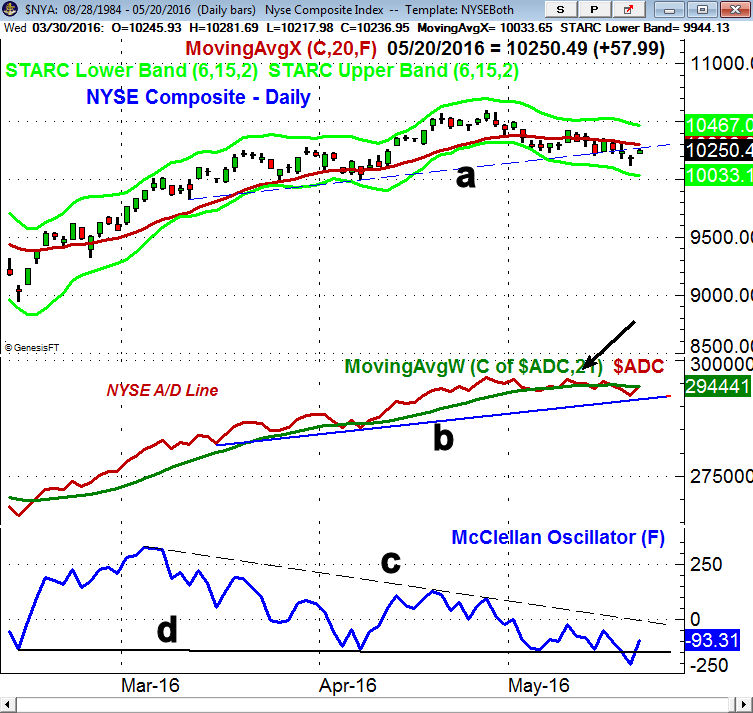
The weekly A/D lines on the NYSE and S&P 500 are holding near the highs and are still well above their rising WMAs. The daily chart shows that the NYSE rallied up to its 20 day EMA and former support, line a, on Friday. The NYSE A/D line has turned up but is still below its WMA. A move above the May 10th high is needed to indicate the correction is over. The McClellan Oscillator dropped below support at line d, last week before Friday's rally. A strong move above the zero line and the long-term downtrend, line c, need to be overcome to signal a change in the trend.
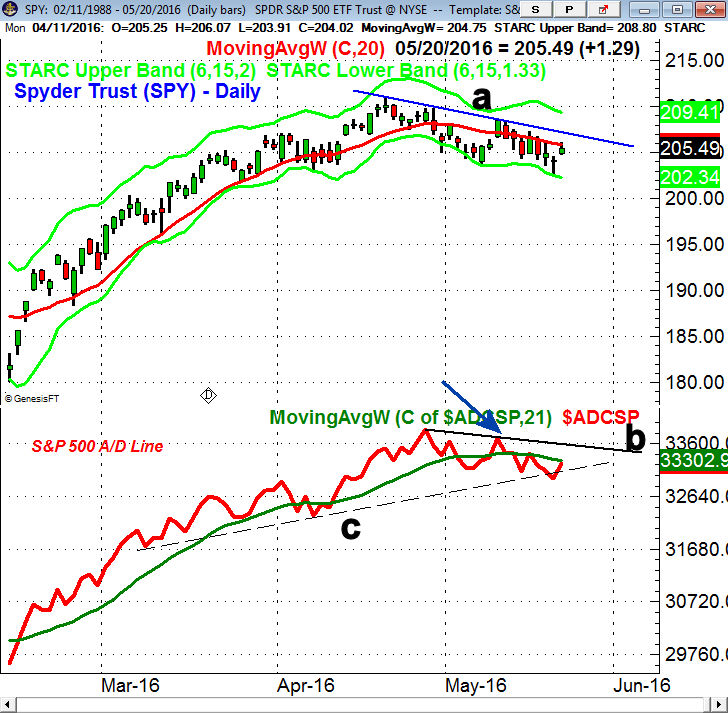
There were mixed signals from Friday's close in the Spyder Trust (SPY). The close was above Thursday's doji high which is a short term positive but the day's high at $206.10 was just barely above the still declining 20 day EMA. This is typical of a rebound in a downtrend but to signal even lower prices the SPY needs to drop below Thursday's low at $202.78.
The S&P 500 A/D line has turned up after slightly breaking the support at line c. The A/D line is still below its declining WMA and the downtrend, line b. This resistance as well as the May high (see arrow) need to be overcome to signal that the correction is over.
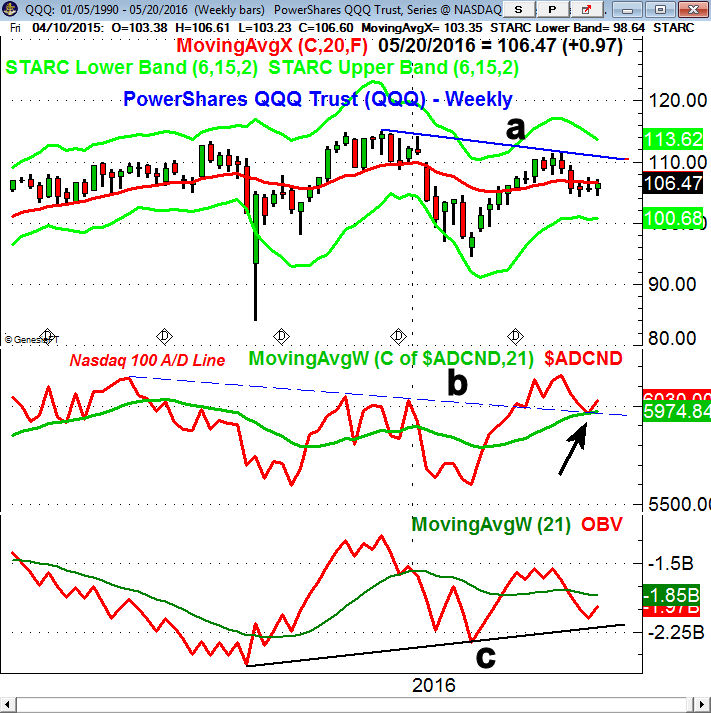
The most positive signs last week came from the technology stocks as the PowerShares QQQ Trust (QQQ) was up 0.9% but was not able to close above the weekly doji high at $107.50. The quarterly pivot at $104.74 was tested again last week but appears to have held. The weekly downtrend, line a, is in the $110.30 area with major resistance in the $114-$115 area.
The weekly Nasdaq 100 A/D line has turned up after testing its WMA and the former downtrend, line b. This is potentially a quite bullish setup. The daily A/D line (not shown) has moved back above its WMA after appearing to hold the support from late March. A few more positive days of market internals is needed to push the A/D line above its downtrend.
On Friday the small cap iShares Russell 2000 (IWM) did much better than the SPDR Dow Industrials (DIA) but the A/D lines for both are still in their downtrends.
What to do? After a very strong market rally from the February 11th lows to the latter part of April the stock market started to move sideways. The deterioration in the A/D indicators and volume suggests that the risk on new long positions was increasing. The high level of complacency also indicated the market was vulnerable.
This kind of deterioration can be followed either by a sharp drop of 5% or by a period of sector rotation. Risk management plays an important part in my recommendations. I would rather stand aside and avoid possible corrections then buy when I felt the risk was high.
The current low level of bullishness and the fact that very few participated in the rally from the February lows does allow for another strong rally. There is the potential for new highs in many of the major averages. This should be signaled in advance by new up trends in the A/D lines. Those investors that embarked on a dollar cost averaging program earlier in the year should continue to buy a regular intervals,
An important part of both the Viper ETF Report and the Viper Hot Stocks Report are the Trading Lessons that are sent out every few weeks. There are designed to help subscribers better understand the markets. They are quite detailed with many specific examples.
Last week's two part Viper Trading Lessons focused on my A/D analysis and also featured examples of how combining the weekly/daily analysis could have helped one sidestep past corrections.
New subscribers to either service (just $34.95 per month) get the three latest Trading Lessons including:
Finding The Best Entry Levels
Finding A Good Exit Price
Telltale Signs of a Correction
Comments
comments