

The quiet end to 2016 set the stage for the resumption of the post-election rally as the three week trading range in the Spyder Trust (SPY) was completed with Friday's close. Though there were some signs of concern from the financial media over the past few weeks the bullish sentiment from AAII hit a six week high on Thursday and at 46.2% is well above its long term average of 38.5%.
The market's angst over the Dow's failure to surpass the 20,000 level will continue this week as the Dow's high Friday was 19,999.63. In the last Week Ahead column the yearly pivot analysis identified that the initial yearly Dow resistance was at 21,320 which is just 6.6% above 20,000.
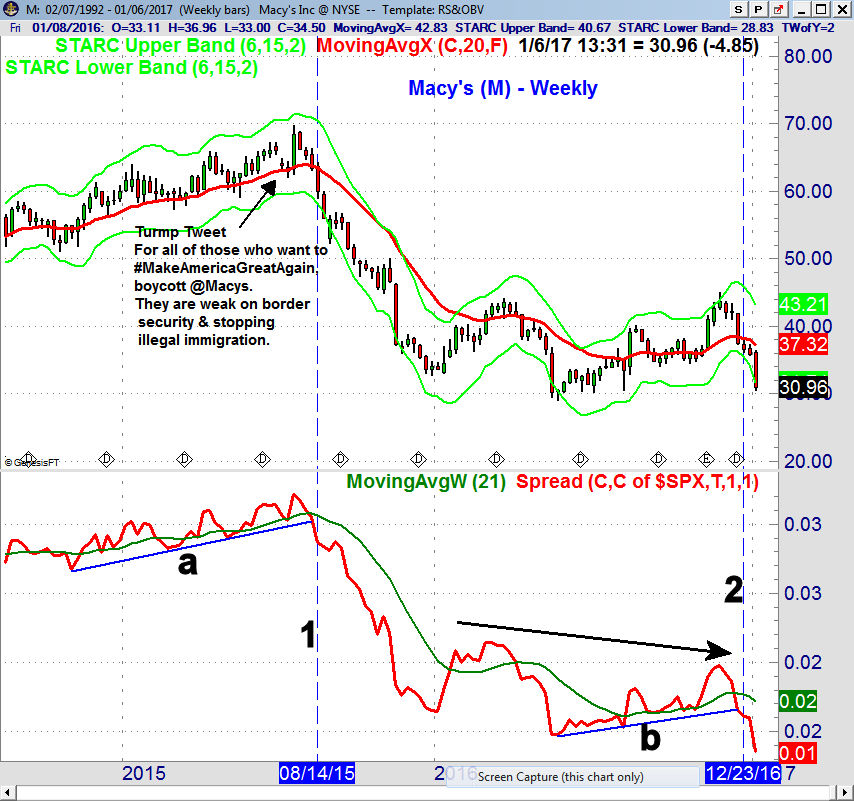
There were a number of stocks that moved lower not higher last week as both Kohl's (KSS) and Macy's (M) reported very disappointing comparable store sales. Their stocks were down 15.9% and 13.5% respectively. Of course Macy's was one of the earliest targets of President elect Trump who on July 1, 2015 recommended boycotting their stores (See Tweet on chart).
Earlier in 2015 Macy's decided to no longer carry the products of Mr. Trump or any presidential candidate which was not well received. Since winning the election many companies have been the targets of Tweets from President - elect Donald Trump. Some are now wondering if he is becoming the short seller's best friend?
It should come as no surprise that I rarely pay much attention to anyone else's opinion of a stock or the market. Often times, like late last summer. The bearish forecasts from many big hedge funds I considered to be a positive for the market. For my longer-term trend analysis, the relative performance, plays a major role. This is a ratio of a stock or ETF to as benchmark like the S&P 500.
In the case of Macy's the RS turned negative on August 14, 2015 (line 1) as the RS dropped below support at line a and its WMA, closing at $59.95. By the end of the year it closed at $33.62. The stock was in a trading range for most of 2016 but the lower highs in the RS (see arrow) indicated that it was not a market leader.
On December 23rd (line 2) the RS dropped below its support at line b which warned of lower prices ahead. The stock closed that week at $36.48 and is now over 14% lower as it is cloed below the starc- band on Friday.
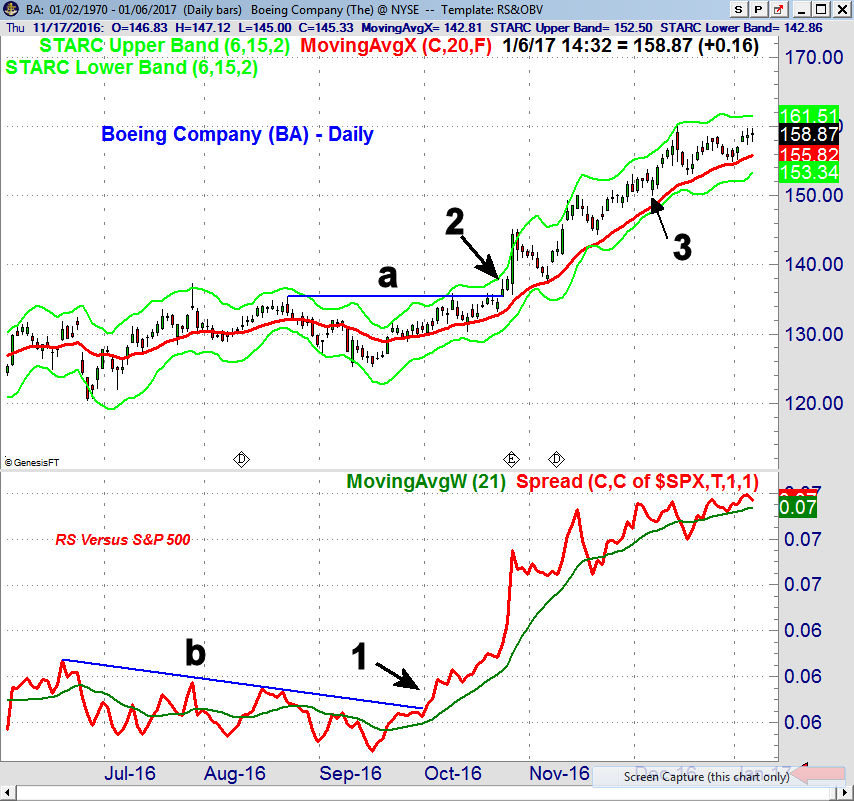
For Boeing (BA), the Trump Tweet on December 6th (point 3) questioned the cost of the new air force one but BA just dropped briefly before rallying to a high of $160.07. The relative performance for BA moved through three month resistance, line b, in early October (point 1) and started to rise strongly. BA did not surpass major resistance at $135.33 (line a) until seventeen days later, point 2, as the RS signaled the breakout in advance.
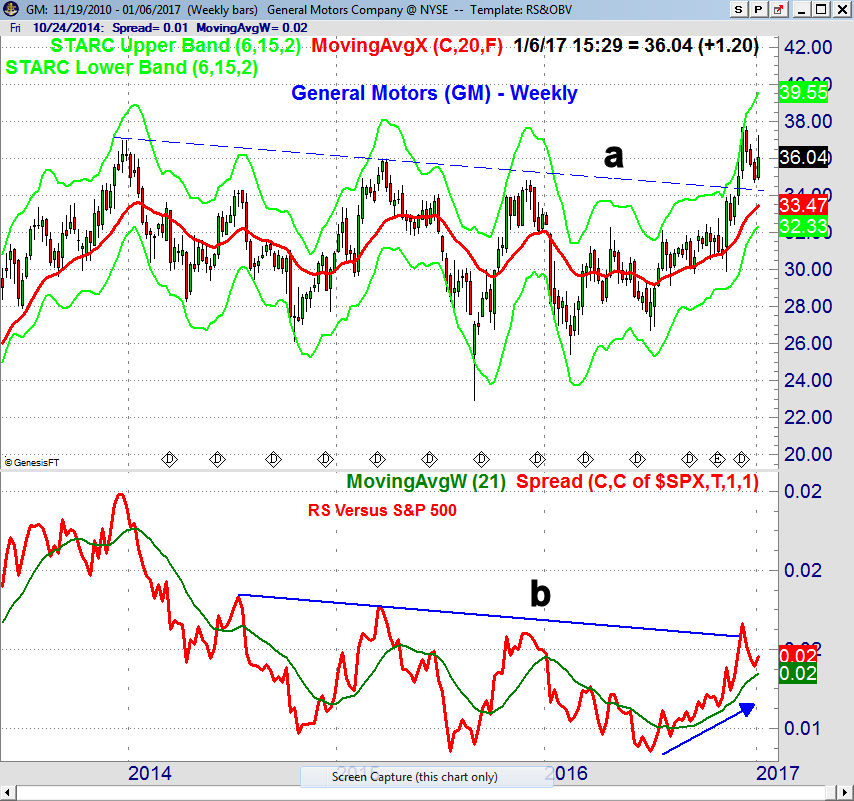
Last week General Motors (GM) came under fire for apparently exporting 4500 hatchback Chevy Cruzes from Mexico to the US without tax because of a NAFTA provision. The weekly chart of GM shows it overcame an almost three-year downtrend, line a, in December.
It has recently pulled back to the breakout level and was actually higher last week. The weekly RS broke through its resistance (line b) in December after being in a solid uptrend since the mid-summer lows. The rising 20-week EMA at $33.47 reflects good support in it's positive trend.
Clearly I think that investors or traders should not make decisions based on any Tweet or headline even though there is apparently a new app called Trigger which will alert you if a company that your are following is mentioned in a Trump Tweet.
Hard data analysis is much more reliable as the relative performance analysis can be done on many free platforms and its long-term trend will not be altered by a single news event. The pivot point analysis also does not require anything but data.
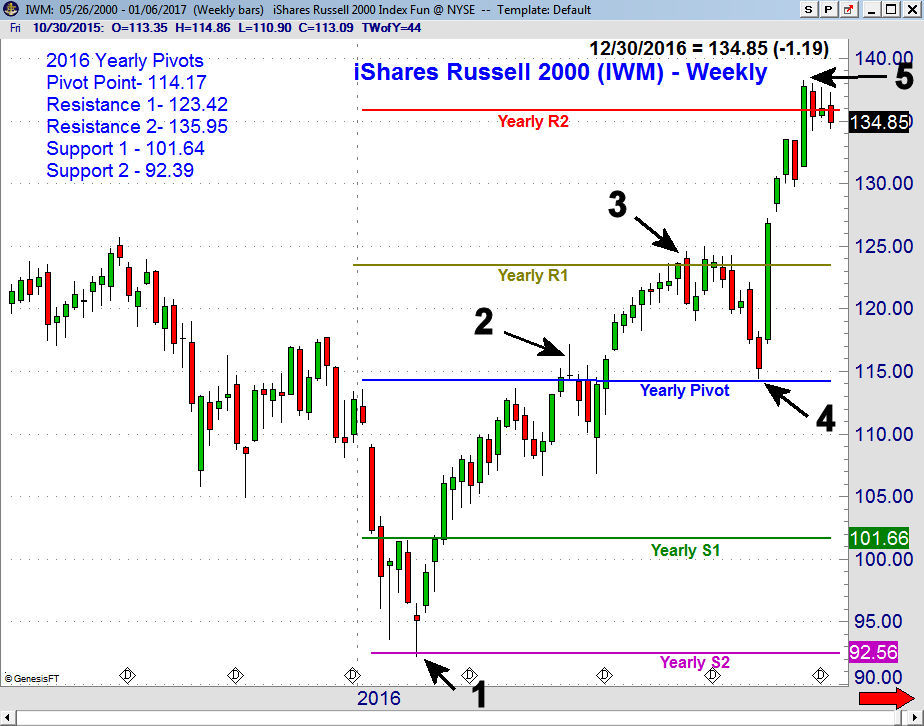
In last Wednesday's article I looked in depth at the yearly price projections for the iShares Russell 2000 (IWM) . The chart shows that both the 2016 yearly highs and lows were predicted in advance by the yearly price ranges from 2015.
I am currently working on a Trading Lesson that focuses on the yearly pivot price projections for the key market tracking ETFs and the major sector ETFs. It will be sent out this week to all current and new subscribers to both the Viper ETF Report and the Viper Hot Stocks Report . There are a number of ETFs that have been lagging since the election but closed Friday above their quarterly pivots.
The Economy
The data on the economy last week was supportive of higher prices and the next earnings season starts unofficially with Alcoa (AA) on Monday. I think it will be a strong earnings season and believe it will push stocks even higher in the 1st quarter.
The ISM Manufacturing Index came in Tuesday at 54.7 above the consensus estimate of 53.8. It has broken out above the resistance, line a, from the spring of 2016. Last Thursday's ISM Non-Manufacturing Index also beat estimates at 57.2 as it matched the November reading. The downtrend, line b, was overcome in September.
Non-farm payrolls were a bit lower than expected on Friday but as noted by Econoday the real story was the "outsized 0.4 percent rise in average hourly earnings, the second such gain in three months. The year-on-year rate is now at 2.9 percent which is a cycle high. A 3 percent rate and above is widely seen as feeding overall inflation."
This week the majority of the data comes out on Friday with the PPI, Retail Sales, Business Inventories and Consumer Sentiment.
Interest Rates & Commodities
The yield on the 10 Year T-Note has declined from the mid-December weekly close at 2.597% as it settled Friday at 2.418%. The quarterly pivot stands at 2.219% with the rising 20 week EMA at 2.132%. The weekly downtrend, line a, was broken the week of the election. The weekly MACD and MACD-His have declined but are still positive.
The ProShares UltraShort 20+ Year Bond ETF (TBT) has dropped 6.6% from its high and is already back to the initial weekly support at $38.80, line b. The quarterly pivot is at $38.29 with the 20 week EMA at $37.79. The volume increased last week as prices declined but the OBV is still well above its rising WMA. The OBV staged a breakout above resistance, line c, in early December.
The monthly chart of the crude oil futures shows that it closed December above the résistance at $52.22, line b, that completed the reverse H&S bottom formation that was discussed several months ago. There is next monthly resistance, line b, in the $62.50 area. The monthly on-balance-volume (OBV) is still acting stronger than prices as it has moved well above the 2015 highs.
The monthly HPI, which uses volume and open interest, broke its downtrend (line d) in May and is also acting stronger than prices. It does indicate positive monthly money flow. Viper ETF subscribers are long the energy sector ETFs and are looking for a setback to add to positions.
Market Wrap
The Nasdaq Composite led the major averages higher last week gaining 2.8% and the Nasdaq 100 was even better gaining 2.9%. Both did much better than the 1.7% gain in the S&P 500 or the 1% rise in the Dow Industrials. Small caps lagged as the Russell 2000 was up just 0.8%. The advance/decline numbers were strong as 2369 stocks advanced with just 724 declining.
Health care and technology were the strongest last week up 3% and 2.3% respectively followed by gains of just under 2% in materials as well as consumer services.
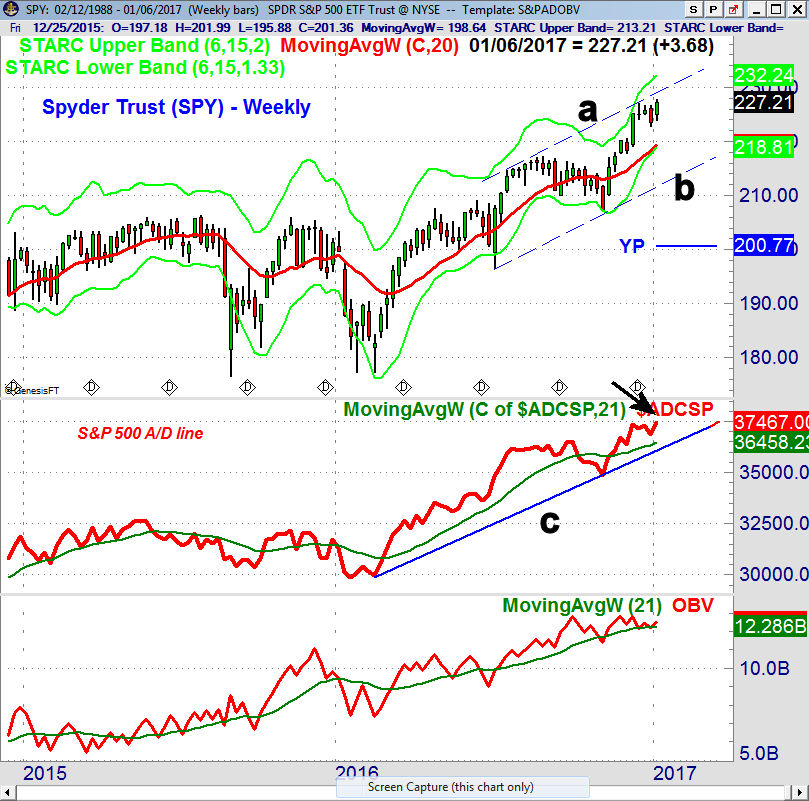
At the start of the week it looks as though the Spyder Trust (SPY) might see a deeper correction but the positive A/D numbers early in the week indicated that the correction was likely over. The drop back towards the 20-day EMA on Thursday was a good opportunity for traders to buy. The next likely upside targets are in the $230-232 area which corresponds to the weekly starc+ band and initial quarterly pivot résistance.
There is initial support at $225-$226 with more important at $222-$223. There is strong weekly chart support, line b, in the $212-$214 area with the yearly pivot at $200.74. The weekly S&P 500 A/D made a new high last week with intermediate support at line c. The OBV has turned up from its WMA.
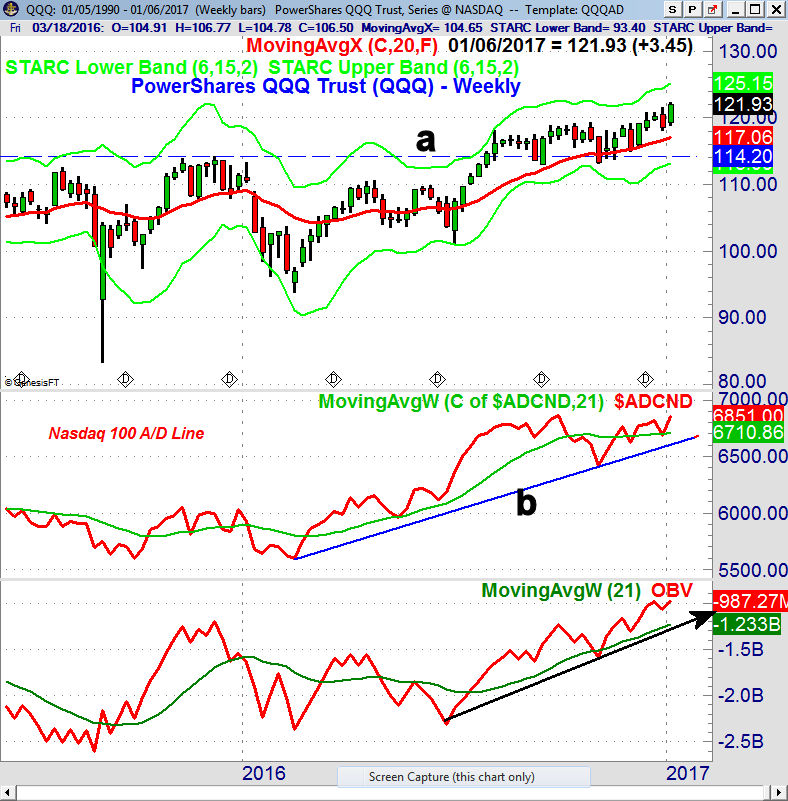
The PowerShares QQQ Trust (QQQ) had been just grinding higher and dropped on the last day of 2016 but the action last week suggests that the patience on the long side of the QQQ may now be rewarded. The daily RS analysis indicates it is just starting to become a market leader. Another strong weekly close will project a move to the weekly starc+ band and quarterly pivot resistance in the $125 area.
The Nasdaq 100 A/D line has moved above its previous high and is very close to the September high. The weekly OBV is still leading prices higher as it has been above its WMA since the Friday before the election. The rising 20-day EMA is now at $119.67.
What to do? The daily A/D lines turned around with the good numbers early in the week and a further rally early this week will add further support to the bullish case. It looks like sector rotation is starting to take over as there were bullish weekly signals in the lagging health care and biotech ETFs.
Buy the election and sell the inauguration is now gaining popularity but new highs in the daily A/D lines should limit the depth of any correction later in the month. Though earnings season does increase the individual stock risk there were over 25 new buys on my weekly scan for Viper Hot Stocks. Several recent recommendations appear to have just completed bottom formations and are well below their 52-week highs.
I continue to suggest that those who are not invested should use any sharp down day to start adding positions in well diversified, low cost ETFs. Those that embarked on a dollar cost averaging plan last summer should be doing well. Before you buy any ETF please do your own research as one should review not only the expense ratio but what % they have in the top ten holdings as well as how many holdings are in the ETF.
If you would like specific buy and sell recommendations which are updated twice each week you might consider either my Viper ETF or Viper Hot Stocks service. New subscribers will also receive the trading lesson on Yearly Pivot Analysis that will be sent out this week.
For those who are interested in becoming a better investor or trader you might consider my individual training sessions. Please email us at wentworthresearch@gmail for more information.
Comments
comments