
The stock market correction that started last Thursday has picked up steam as the market bears are getting louder once more as a couple of new layers have been added to the wall of worry. The upcoming Brexit vote does have a chance of rocking the boat temporarily but the longer term measures of the A/D line do not suggest that a vote related drop will complete a major top.
Of course the high number of bear market forecasts is positive as it should provide fuel for a rally. It is interesting that a four day pullback and 2% decline has stimulated this degree of bearishness. The market is now less overbought as the NYSE McClellan Oscillator has dropped from +141 last week to -208 Tuesday as I Tweeted earlier this morning.
The Spyder Trust (SPY) has pulled back to good support as it dropped below the monthly pivot at $207.77 before closing above it. This widely watched market tracking ETF formed a doji Tuesday and a close above $208.74 will trigger a positive momentum shift. I am still look for Spyder Trust (SPY ) to reach the quarterly pivot resistance at $214.58 with additional targets in the $218-$220 area.
One ETF that has been leading the Spyder Trust (SPY) higher all year is the Materials Sector Select (XLB) as it is up 8.3% YTD and is up over 29% from the lows early in the year. In contrast the SPY is up 2.6% YTD and 15.5% from the year's low.
In last week's "Why Didn't I Buy This Mining ETF?" I explained why I was not ready to buy the SPDR S&P Metals & Mining ETF (XME) because the risk was too high. This meant that the correction needed to be watched. The situation was different for the Materials Sector Select (XLB) as the analysis of the weekly and daily technical studies demonstrate why I favored buying it on the recent dip.
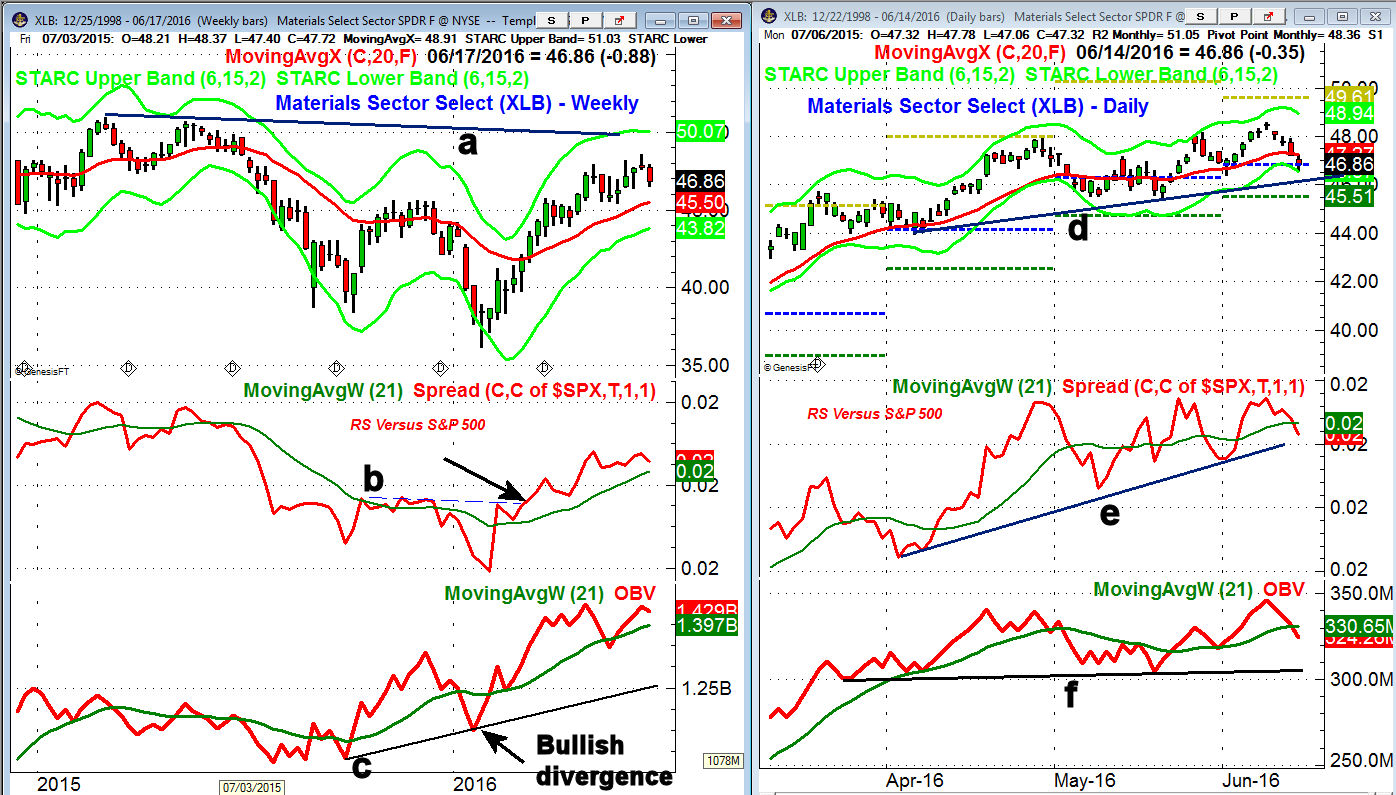
The weekly chart shows that the Materials Sector Select (XLB) bottomed almost three weeks before the SPY in the middle of January. There is next long-term resistance, line a, in the $50 area.
- The weekly relative performance is one of my favorite indicators and it moved above its WMA in early February signaling it was now a market leader.
- The weekly RS resistance, line b, was overcome in early March.
- The weekly OBV formed sharply higher lows in January and this bullish divergence warranted new long positions.
- The OBV has not yet surpassed the April highs but is still well above its rising WMA.
- The recent correction has taken prices back to initial weekly support at $46.37.
The daily chart shows that a doji was formed a week ago which set the stage for a pullback.
- The monthly pivot at $46.85 was reached on Tuesday with daily support, line d, in the $46 area.
- The monthly pivot support is at $45.51 with the May swing low at $45.42.
- The daily relative performance shows a well-defined pattern of higher lows, line e, and has just dropped below its WMA.
- The daily on-balance-volume (OBV) made another new high last week but has also dropped below its WMA.
- There is important OBV support now at line f.
- The monthly R2 resistance is at $49.61 while the recent trading range has targets in the $50-$51 area.
What to Watch The overall market needs a couple of days of strong price action and 2-1 positive A/D ratios to confirm that the correction is really over. Last week our strategy for Viper ETF clients was to buy the Materials Sector Select (XLB) at two different levels as it corrected so the risk was tolerable. The key market tracking ETFs were also recommended on the correction but risk control as always is the key.
Comments
comments