

As the euphoria in the stock market continues to build with each new high in the major averages . The extent of the rally and the fund flows suggest that some investors are now investing with little regard to risk.
Some of the professional media analysts were not exhibiting much caution even though a guest analyst suggested waiting to buy the the financial stocks like the regional banks. In the short period since the election it seems that many have thrown caution to the wind with a few analysts using those most dangerous words "this time is different."
The rally has focused on the Russell 2000 and the financial sector. The last fifteen-day winning streak in the Russell 2000 occurred in February 1996, According to the Wall Street Journal the Russell 2000 was 2.4% higher after the long winning run in 1996 and was up 8.7% in the next three months. The gain in February 1996 was 6.1% much less than the current 12.7% gain.
The starc band analysis has had a good record of alerting investors and traders to price extremes in stocks, ETFs and commodities. The bands were developed by the late Manning Stoller who was a colleague for many years and he had great market insights.
These bands are based on adding or subtracting two times the average true range (ATR) from a moving average. Manning had determined that using 2 ATR would incorporate 92% of the price activity but if 3 ATR were used about 99% of the price activity would stay inside the bands.
When prices are above the stac+ band prices are in a high-risk buy or a low risk sell area. If prices are below the starc- band they are in a high-risk sell area or a low risk buy area. These bands are used extensively in both the Viper ETF Report and Viper Hot Stocks Report to identify high or low risk buy or sell areas as well as to determine profit-taking levels.
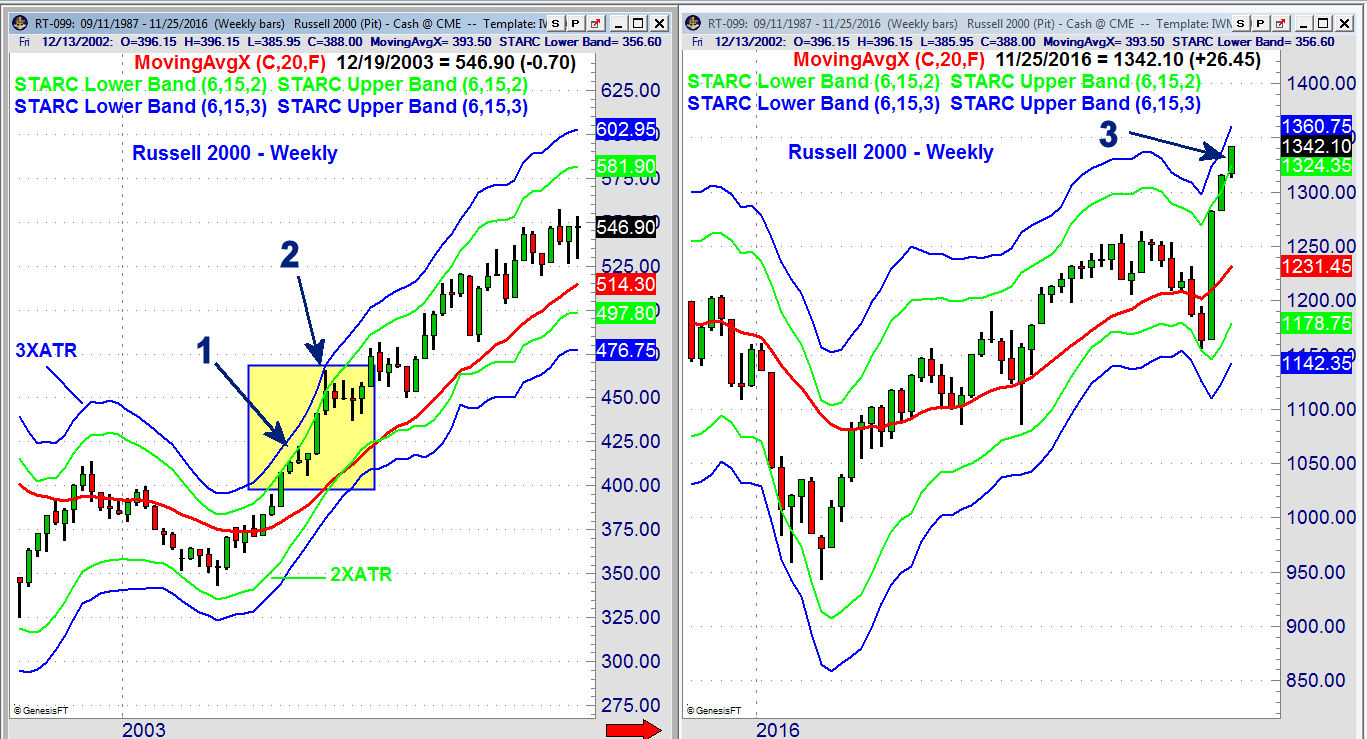
Three weeks ago the Russell 2000 Index closed at the weekly starc+ band and for the past two week's it has closed well above the 2XATR band (point 3). With Friday's close at 1342 it is now just 1.3% below the 3XATR band (in blue) at 1360.
Since 2001 the 2XATR starc+ band has only been tested and exceeded one other time which was in May through early June of 2003. After the 2XATR was first reached (point 1) it was tested for the next two weeks before a 3.7% correction that lasted one week.
This was followed by a 14.7% rally that lasted three week as the 3XATR starc+ band was reached at point 2. The Russell 2000 traded sideways to lower for the next four weeks as it corrected over 6% before the uptrend resumed.
Clearly the Russell and the iShares Russell 2000 (IWM) are now in a high-risk buy area as using a stop under the 20 week EMA at $122.36 would mean a risk of 9%. The current analysis indicates that a 3-5% correction is very likely before the end of the year but it still may come from higher levels.
In the October 22nd column "Market Insights From Past Election Years" I discussed the bullish action of the DJ US Financial Sector (DJUSFN) and noted that "the RS line has turned up from its WMA consistent with a market leader." The key level to watch was the resistance at 460 which was surpassed with the close at 472.13 on Friday November 11th.
For the past three weeks DJUSFN has closed above its weekly starc+ band as it has gained over 8% since 10/22. The last time this measure of the financial sector closed above its weekly starc+ band was in May of 2013 and six weeks later it had corrected over 7%.
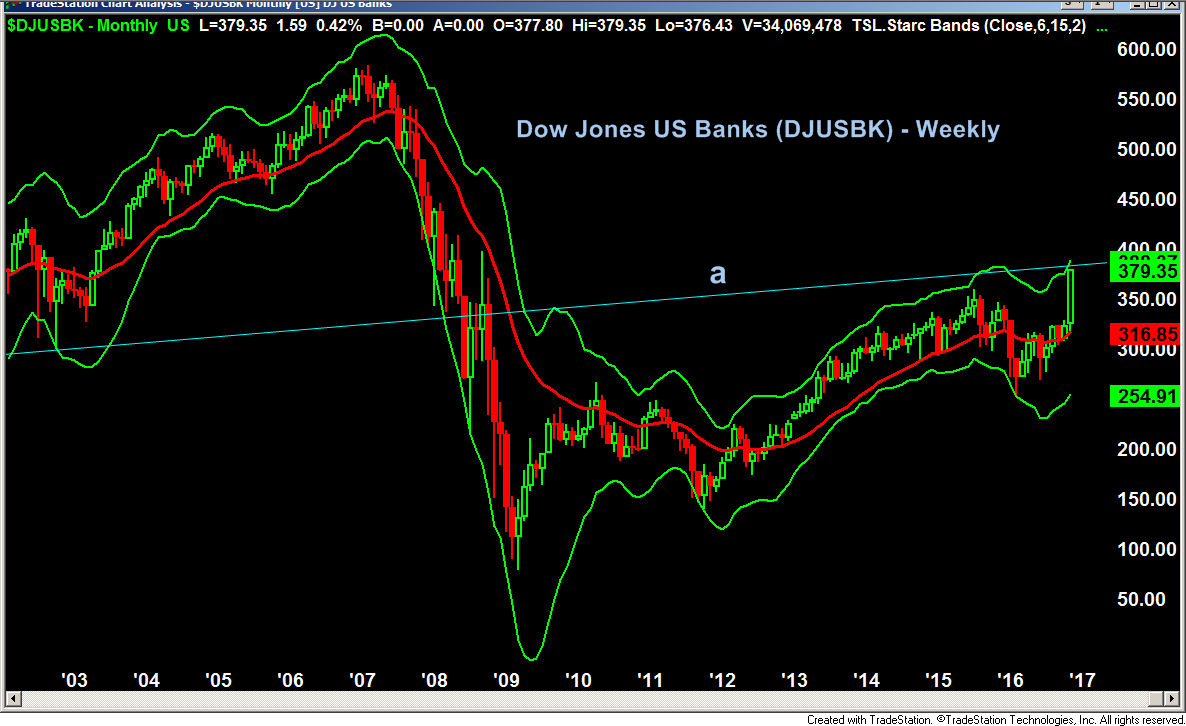
The bank stocks have been one of the top performing financial industry groups since the election as the Dow Jones US Bank Index (DJUSBK) it is up 16.1%. The long term monthly chart shows that it is now trading above the monthly starc+ band and has reached long term resistance, line a, that goes back to 2000-2003.
The SPDR KBW Regional Banking ETF (KRE) has gained almost 19% since the election as it has closed above the weekly starc+ band for the past three weeks and is now just below the monthly starc+ band. The Viper ETF Investors sold their position last week at $51.86 for over a 23% profit.
The KRE closed a bit higher Friday at $52.30 and could even reach the $53-$54 area before there is a meaningful correction. It is likely to be even higher in next six months so I will be looking for a 3-5% correction as a new buying opportunity.
So should investors and traders view risk differently in the new Trump fueled market? I would argue that investors should consistently apply the same risk management approach even in unusually bullish or bearish times. It is important that the focus is on the risk not the reward of any investment or trade. If you are a patient and do not invest or trade emotionally you are less likely to buy the high and should have a lower risk.
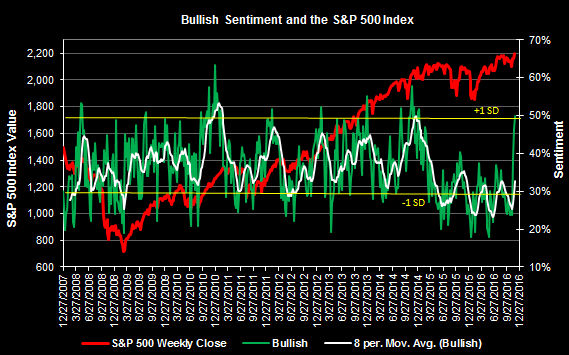
The bullish sentiment has continued to expand as 49.9% are now bullish up 3.2% from the prior week while the bearish % has fallen 4.5% to just 22.1%. The chart shows that the bullish % has moved one full standard deviation above the mean but as I noted last weekend this is still not at an extreme level of bullishness and it often tops out well ahead of prices.
The Economy
In general it was a good week for economic data as the Chicago Fed National Activity Index was still negative but did improve sharply from last month. Existing Home Sales were up 2% and Durable Goods jumped an impressive 4.8%. New home Sales were down 1.9% in October but up 17.8% on a yearly basis.
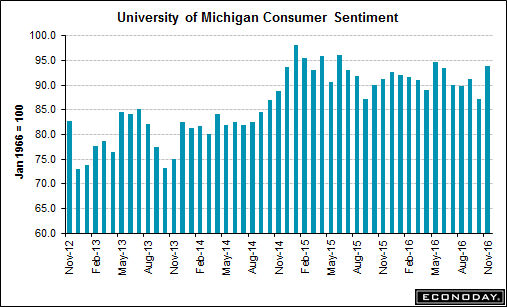
Consumer Sentiment also has rebounded to 93.8% which is up from last month's reading of 91.6. This has broken the near term downtrend which is an encouraging sign. The flash reading on PMI Services also held firm from the prior month.
This week we have the Dallas Fed Manufacturing Survey with the 3rd quarter preliminary reading on GDP. The Consumer Sentiment is also out on Tuesday along with the S&P Corelogic Case-Shiller Housing Price Index.
On Wednesday we have the ADP Employment Report, Chicago PMI and the Pending Home Sales Index. Just ahead of the jobs report on Friday we have the ISM Manufacturing Index, the PMI Manufacturing Index, Construction Spending and the regular Thursday jobless claims.
Market Wrap
It was another banner week for the stock market and finally the A/D numbers matched the strength of the averages as 2454 stocks were up and just 662 down. The Russell 2000, Dow Transportations and Dow Utilities all gained over 2%.
Basic materials were up 2.9% for the week, followed by 2.4% in the industrials, 2.3% for oil & gas and consumer services were 2.1% higher. The energy stocks held up well in Friday's short session while crude oil reversed sharply and triggered a daily doji sell signal to close the week lower.
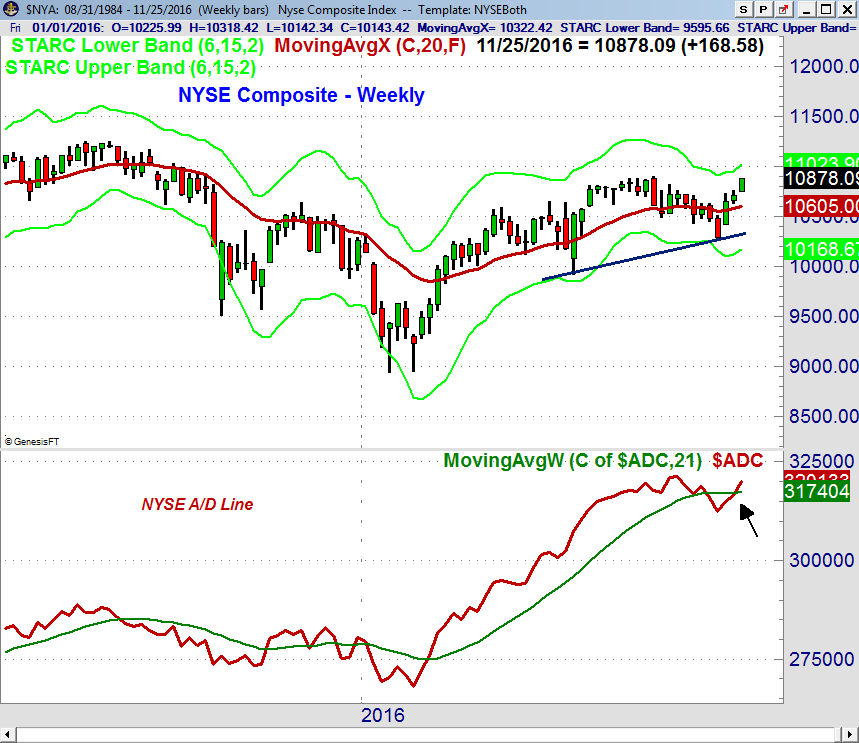
The NYSE Composite finally overcame the resistance at 10,750-800 with the weekly starc+ band at 11,023. There is quarterly pivot resistance at 11,239 with daily support and the 20-day EMA at 10,682. The weekly A/D line has now clearly moved above its WMA but is still below the September high. The daily A/D line (not shown) has broken the downtrend from the September highs.
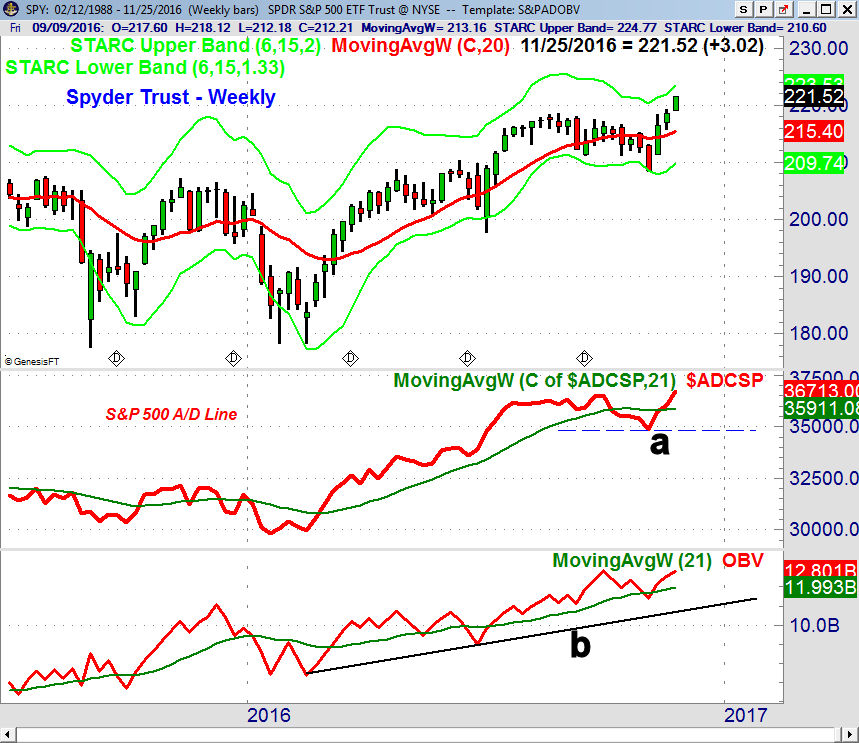
The Spyder Trust (SPY) was up 1.38% last week and is now just below the weekly starc+ band at $223.52. The quarterly pivot resistance stands at $226.82. There is minor support at $220 with the rising 20 day EMA at $217.67.
Both the weekly and daily S&P 500 A/D lines have moved above the September highs which confirmed the price action. Last week the A/D line had just moved above its WMA which made this week's close more important. The weekly OBV is very close to making a new high.
The Russell 2000 A/D line has moved well above the previous all time highs and has confirmed the price action. Neither the Nasdaq 100 or Dow Industrial A/D line has made new highs but they are above their weekly and daily WMAs.
What to do? Bond yields continued to rise last week as the yield on the 10 year T-Note rose to 2.372%, closing well above the weekly starc+ band for the third week in a row. Clearly the bond market has already priced in a December Fed rate hike and even more. A fair amount of the new money going into equity ETFs is coming from the bond market.
Though the market did not complete a short-term top last week which I thought was likely but a risk-focused approach is still best. For those on the sidelines it is hard to watch the market move higher and higher without chasing it. The market correction is likely to be even sharper if stocks move higher again this week. Those who are under invested should look to start buying on the first sharp down day
There are still some ETFs that are just starting to join the party and I will have some new buy orders for Viper ETF clients on Monday.
The weekend scan for Viper Hot Stock traders revealed eleven stocks with new buy signals and as always I will also be reviewing last week's scan to see if any stocks have moved to attractive buy levels.
If you are interested in my market analysis during the week and want specific recommendation you might consider one of my services. Each is only $34.95 per month and includes regular trading lessons along with the twice a week reports. New subscribers also receive four of the most recent trading lesson and subscriptions can be cancelled anytime on line.
Comments
comments