

The stock market was lower in early trading Tuesday which supported the view of some that the Trump rally was over. By the close the Spyder Trust (SPY) was down just 0.35% and the NYSE advance/decline numbers were only slightly negative with 1354 up and 1657 down.
The daily A/D lines that were reviewed last week are still holding above support and have not moved into the corrective mode by dropping below the late December lows. Furthermore the Nasdaq 100 A/D line closed very strong last Friday as it has accelerated to the upside (see chart)
The earnings for CSX Corp (CSX) after the close had many wondering whether the major rally in the Dow Transports was over. The iShares Dow Transportation (IYT) was down 1% on Monday but is up 14% over the past three months. This is in contrast to the 7% gain in the Spyder Trust (SPY) but what is next technically for the Dow Transports?
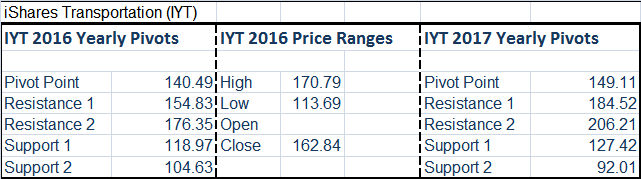
The yearly pivot analysis, that was very accurate for the SPDR Dow Industrials and iShares Russell 2000 (IWM) shows that the yearly projected high for IYT is at $184.52 with the yearly pivot at $149.11. The 2016 close was well above the 2016 pivot at $140.49.
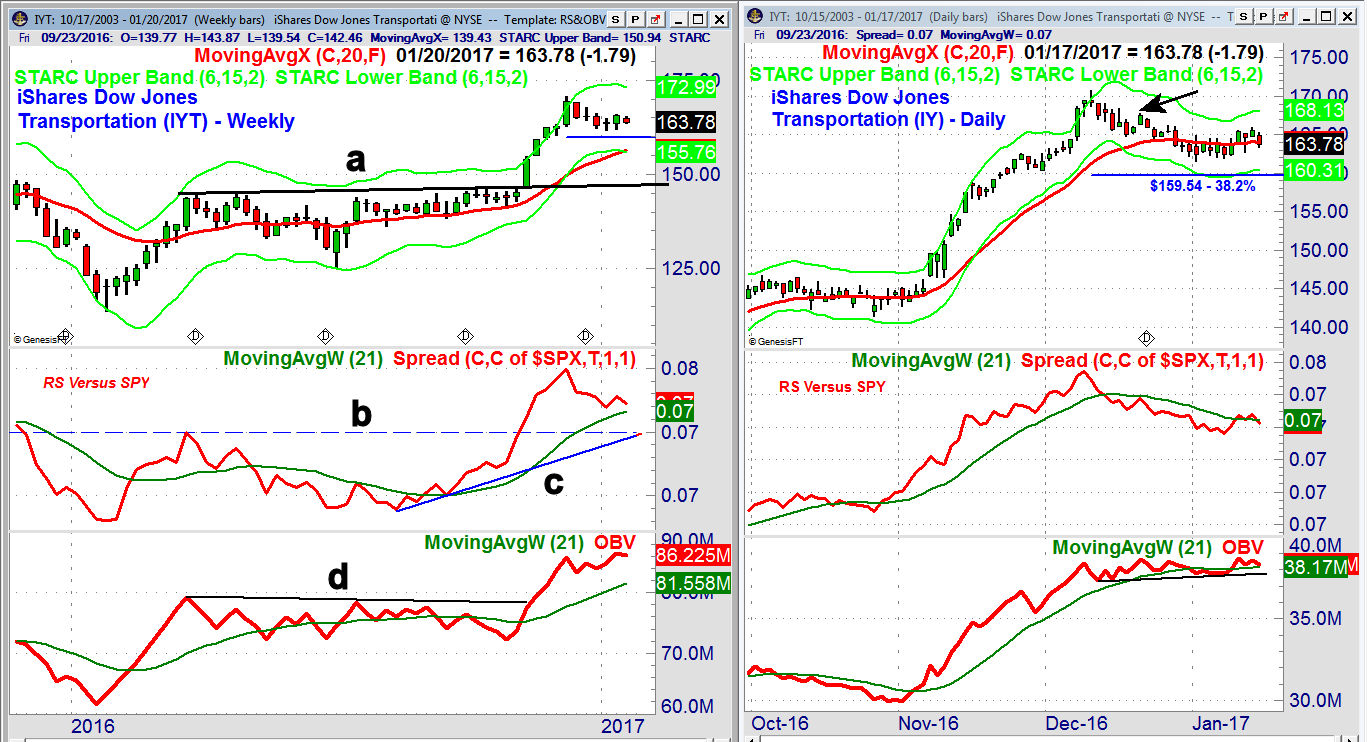
The iShares Dow Transportation (IYT) is down over 4% from the December 9th high at $170.79. The week ending January 6th IYT formed a doji and a weekly doji buy signal was triggered with last Friday's close.
- The quarterly pivot is at $158.56 with the rising 20 week EMA at $156.33 and the starc- band at $155.76.
- The relative performance analysis (RS) reveals that IYT completed a bottom last fall versus the SPY indicating that it was a new market leader.
- The weekly RS has pulled back from the December high but is still well above its WMA. It has converging support at lines b and c.
- The weekly on-balance-volume (OBV) has held up very well after breaking through the major resistance, line d, in November.
- The OBV is well above its rising WMA and shows no signs of a top.
The daily chart of iShares Dow Transportation (IYT) shows a fairly orderly pullback from the December highs with the flattening 20 day EMA at $164.01.
- The recent low is at $161.58 with the 38.2% Fibonacci support from the October high at $159.54.
- The monthly pivot support is at $159.52.
- There is short-term resistance at $165.91 and a move above the last major swing high at $167.73 (see arrow) should confirm that the correction is over.
- The daily RS (relative performance) is trying to bottom out but needs to move above last week's high.
- The daily OBV is holding above its WMA and the support at line e.
- If it this daily support is broken and the OBV starts a new downtrend it will signal a deeper correction.
Summary: The financial media is coming up with many reasons why the transportation sector will not benefit from Trump's programs until later in the year. The technical outlook favors being a buyer not a seller and a bottom could be confirmed in the next week. There is converging support in the $159.50 area. I will be posting weekly charts of both the S&P 1500 Airlines and Railroads indices later on Twitter.
If you like this type of technical analysis you might consider my Viper ETF Report or the Viper Hot Stocks Report . Both include regular Trading Lessons and are $34.95 each per month.
Comments
comments