The stock market had plenty of news to digest last week with a full calendar of economic reports including the monthly jobs report, 43 more S&P 500 stocks reporting earnings and the long awaited House vote on the repeal of Obama care. Still too early to relax completely as there is phase two of the French election over the weekend.
A surprise win by Marine Le Pen is still the market Achilles heel. Such a win seems quite unlikely according to the polls as well as experts here and overseas but as we know strange things can happen. Global stocks would likely react very negatively to such a win and this does not look likely from the charts.
With only 18% of the S&P 500 stocks yet to report I think it is safe to say that it has been a great quarter for earnings. In early April some financial commentators used the prospect of disappointing earnings as a reason why investors should avoid stocks.
As I commented at the time " Investors should continue to look at declines caused by negative headlines or concerns about a major market top as a buying opportunity until there is evidence of a recession or bear market."
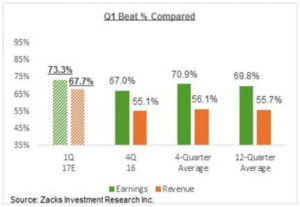

From the excellent Zack's article on the earnings season their chart shows that 73.3% of S&P 500 companies beat estimated 1st quarter earnings and 67.7% beat on revenues. They commented "As of Friday, May 5th, we have Q1 results from 412 S&P 500 members that combined account for 85.7% of the index’s total market capitalization. Total earnings for these companies are up +14.2% from the same period last year."
The strong earnings were accompanied by an eight week decline in bullish sentiment that ended recently. The sentiment change since the March 1st high coincides perfectly with the chart formations.
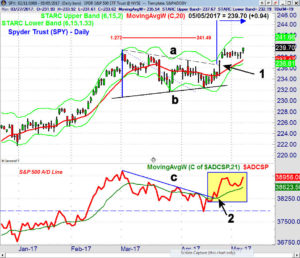

Before the open on Friday I posted this on Twitter and gave an expanded technical description of the Spyder Trust (SPY) on my new Viper Report Facebook page. In the future I will be posting more detailed commentary on Facebook then I can on Twitter.
The chart shows a classic triangle or flag formation (lines a and b) which in technical terms is a continuation pattern. In classic technical analysis it signifies a pause in the prevailing trend, with the expectation that the prior trend will eventually resume. They can occur in an up or down trend.
The flag was completed on April 24th (point 1) and since then the SPY has moved sideways but with Friday's close it looks as though the rally is ready to resume. The minimum target is the 1.272% retracement target which is at $241.49. By measuring the width of the flag there are additional targets at $244-$246.
The completion of the flag was confirmed by the S&P 500 A/D line as it broke its downtrend (line c) several days before the SPY broke out, point 2. Since then the A/D line has been holding above its rising WMA and it turned up nicely on Friday. Often technical indicators like the OBV and the relative performance will often break out ahead of prices.
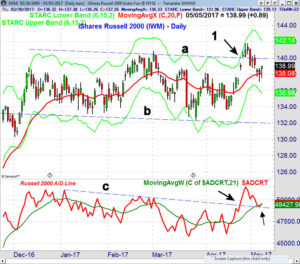

The iShares Russell 2000 (IWM) reveals another type of continuation pattern. IWM had been in a horizontal trading range, lines a and b, until the end of April when it broke out to the upside (point 1). Last week IWM pulled back to its 20 day EMA but Friday's higher close is positive sign even though it was down slightly for the week.
The Russell 2000 A/D line broke through resistance from early in the year, line c, on April 24th as it preceded the price breakout. The A/D line soon made a new all time high but pulled back to its WMA last week. The A/D has now turned up from its WMA which is a bullish setup and the initial buying zones for Viper ETF traders in both IWM and SPY were hit last Thursday.
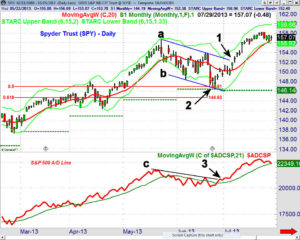

Continuation patterns are one of my favorite investing and trading chart formations as you can find them on monthly as well as daily, weekly or intra-day charts. In May and June of 2013 the SPY formed a similar flag formation as it has this year. The SPY dropped to a low on June 25th of $146.66 which was just above the monthly pivot support (green line) at $146.44. This is one of the entry techniques that I teach in my Viper Trading lesson.
Just eight days later on July 8th the formation (lines a and b)was completed, point 1, and the SPY made new a new high just two weeks later. The S&P 500 A/D broke its downtrend, line c, six days before prices broke out to the upside (point 3).
Learning how to identify continuation patterns cannot only help you find good profit opportunities but they can also keep you out of trouble. Stocks that have completed continuation patterns are often recommended in the Viper Hot Stocks Report.
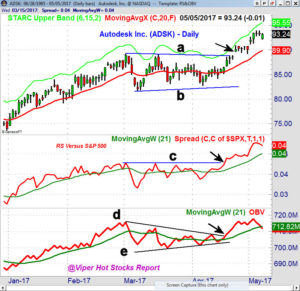

For example, new longs in Autodesk Inc. (ADSK) were established just over a week ago. The daily chart shows that its continuation pattern, lines a and b, was completed on April 24th. ADSK consolidated for several days before turning higher last week.
The relative performance broke through its resistance, line c, three days ahead of prices. The daily OBV also completed its triangle formation, lines d and e, several days before prices. The continuation patterns also allow one to easily place stops in order to limit the risk.
There is more on the technical outlook in the Market Wrap section and last week's performance does support last week's view that you should ignore the calls to sell in May.
The Economy
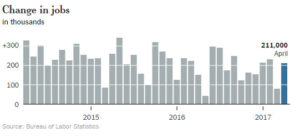

The stock market spent most of the week drifting lower as it absorbed a full calendar of economic and earnings reports. This culminated in the monthly jobs report and the increase of 211,000 jobs helped remove some of the concerns from last month's low number.
Monday's reports on manufacturing from ISM and PMI met expectations. The service numbers were stronger than expected as the ISM Non-Manufacturing Index came in at 57.5 better than the consensus estimate of 55.8. Last week's Factory Orders were a bit weaker than expected.
This week the calendar is light with the PPI on Thursday followed by the CPI, Retail Sales, Business Inventories and Consumer Sentiment on Friday.
Interest Rates & Commodities
The yield on the 10 year T-Note rose last week to close at 2.352% up from the low of 2.177% three weeks ago. There is no real change yet in the technical outlook but the current rebound should still be watched closely.
Crude oil prices collapsed last week as the July contract dropped to a low of $44.13 which was well below the weekly starc- band at $46.10. Even though there were no signs of a bottom last week in my article "Watch For A Bottom In Crude Oil & XOP" I pointed out that as more important support was reached one should be looking for a bottom especially in energy ETFs. Last week the SPDR S&P Oil & Gas ETF (XOP) was only down slightly as it rebounded from the lows and formed a doji.
Market Wrap
The gains for the week were mostly not that impressive though the Nasdaq 100 was up 1.1% followed by just over a 1% gain in the Dow Transports. The S&P 500 was up 0.63% with the Industrials gaining just 0.32%. The small cap Russell 2000 was down 0.25% but closed well above the lows. The weekly NYSE A/D numbers were just barely positive.
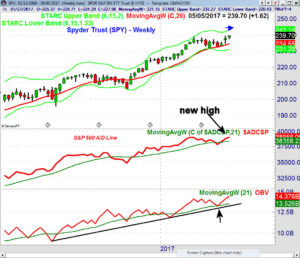
The Spyder Trust (SPY) traded in a narrow range last week but did close higher with monthly pivot resistance at $240.91. There is quarterly pivot resistance at $242.74 with the weekly starc+ band at $243.14.
The weekly S&P 500 did make a new slight new high last week as the negative divergence has been overcome. The weekly OBV tested the rising WMA in the middle of April but has now also made a new high.
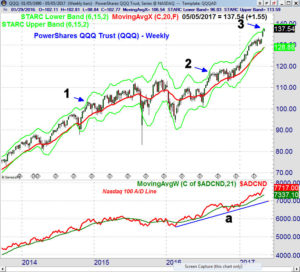

The PowerShares QQQ Trust (QQQ) closed above the weekly starc+ band last week and this week it stands at $138.04. There is yearly pivot resistance at $138.99 with quarterly pivot resistance at $141.85. Since 2014 there have been only two instances when the QQQ has come this close to the weekly starc+ band.
The first was in late November of 2014, point 1, which was followed by a three week drop back to the rising 20 week EMA. The next time was in early August of 2016, point 2, which was followed by four weeks of sideways trading before the QQQ dropped to the 20 week EMA in the middle of September.
It should be noted that the sharp rally in the Nasdaq 100 A/D line over the past three weeks is bullish and it is currently acting much stronger than it was in 2014 or 2016. The A/D line is also well above its rising WMA. The daily Nasdaq 100 A/D line (not shown) also made a new high on Friday and looks very strong.
As I noted earlier the IWM has also completed its continuation pattern and may now be ready to outperform even the QQQ. Take a look at the chart of the SPDR Dow Industrials (DIA) can you find the completed continuation pattern? (Look for a Tweet on Sunday).
What to do? With last week's action all of the A/D lines except the Dow Industrials A/D line have made a new high. The charts also indicate a positive month for stocks which for now seems to be a minority opinion. Late news of hacking to influence the French election makes it the remaining hurdle for the market to overcome as we head into next week.
Before we see a significant correction we should be warned by deterioration in the A/D lines that typically takes a few weeks to develop. The first warning would be a significant weekly reversal .
There are still a number of ETFs that appear to have just bottomed out and several were recommended last week to Viper ETF subscribers. They are holding long positions in the QQQ and as well as other sector ETFs including XBI, XLY, XLK, VHT, IEFA, FDN and VBK. If you are interested in specific buy and sell advice in ETFs, you might consider a one-month investment of just $34.95.
There were a number of new stock recommendations in the Viper Hot Stocks Report and several of the long positions made new highs again last week. Subscribers get two reports each week and the services can be cancelled on line at any time.


Comments
comments