Over the past twenty years, I have applied my unique relative performance (RS) analysis to find the best ETFs and stocks. This methodology has provided me with the key insight to determine which ETFs/stocks to buy and also identify those to avoid or to sell short.
The comparison or ratio of an ETF or stock to a key market average, like the S&P 500, has been used for decades. My RS analysis incorporates multi-time frames using both patterns and moving average analysis.
The addition of many new analytical tools in the last decade has allowed the investor or trader to supercharge the selection process. Once the stock market completes a bottom a the ability to apply RS analysis can be a critical factor in your investment success.
In this first installment of articles in this series, I will look at what happened at the bear market lows in 2003 and what that meant for the next four years. The bull market in the growth-heavy Nasdaq Composite ended in March 2000. MicrosoftMSFT, Cisco, IntelINTC, and QualcommQCOM were four of the largest growth stocks in that bull market.
These stocks bore the brunt of the selling as Microsoft (MSFT) from the December 1999 high of $38.04 MSFT declined 66% by the December 2000 low of $12.77. These RS techniques would have given you a valid reason to exit MSFT in the $34 area in early 2000.

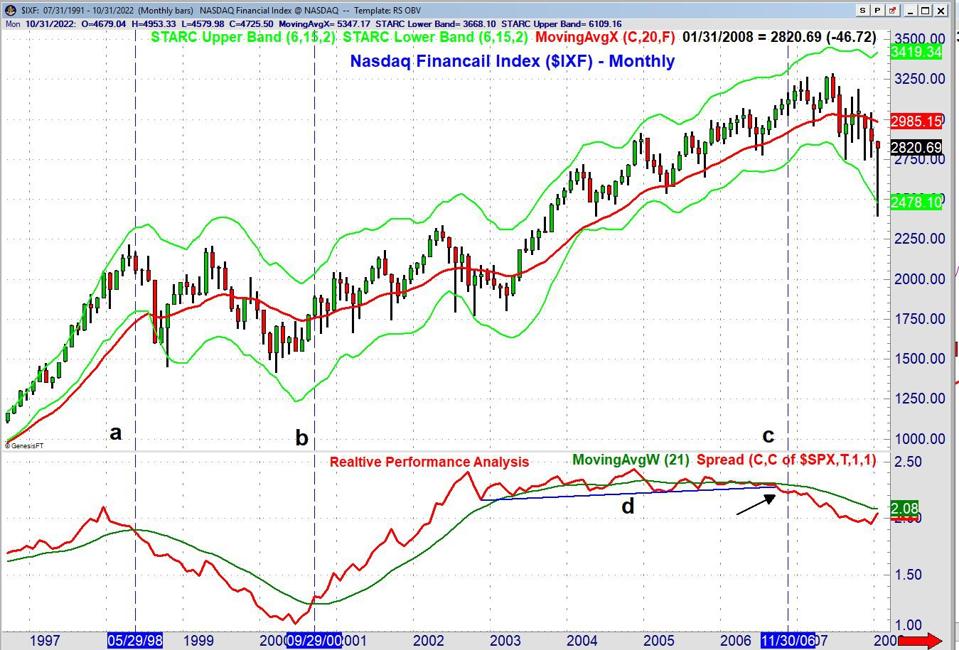
The relative performance (RS) is calculated by dividing the market sector, stock, or ETF by the price of a benchmark like the S&P 500. It is plotted below the Nasdaq Financial Index ($IXF) in red. The green line is a 21 period weighted moving average of the RS. When the RS is declining, as it was from May 26, 1998 (line a) until September 29, 2000 (line b), $IXF was weaker than the S&P 500.
The direction of the RS does not mean that the price of $IXF is rising or falling it just represents how $IXF is performing versus the S&P 500. Between the dates marked by lines and b, the S&P 500 rose 15% while the $IXF declined 9.1%, a differential of over 24%. If your portfolio was in the financial stocks of the $IXF during the last two years of the dot.com market you missed the most explosive phase of the bull market.
RS rose sharply until the latter part of 2002 and its WMA was in a strong uptrend. It was in a trading range from 2003 until 2006 but the RS dropped below its WMA in August 2006. Then in November 2006, the RS dropped below the support at line d and began a new downtrend.
From September 9, 2000, through November 2006 $IXF rose from 1882 to 3121.9, a gain of 39.7%. During the same period, the S&P 500 rose from 1080 to 1249 which was an increase of 13.6%. Therefore $IXF outperformed the SPX by 26.1%. The $IXJIXJ made its high in June 2007 at 3289 before it dropped sharply as in March 2009 it had a low of 1223. The financial stocks were hit the hardest during the bear market of 2007 through early 2009.
If one did move out of the financial stocks before the bear market, what ETFs or stocks emerged as leaders in the next bull market?
Learning From The Last Financial Crisis
For those who survived the financial crisis and bear market of 2008-2009, there was quite a bit of debate following the March 2009 lows as to what sectors or stocks would be the new market leaders.
Those watching the key sectors as 2008 was ending were able to gain some valuable insights if they were using the right tools. In 2008, the Consumer Staples Select (XLPXLP) was down 15.4% and it was the best-performing sector as the S&P 500 was down 37%.
The relative performance (RS) analysis was discussed in the first installment of this series on ETF and stock picking. The RS is a ratio of a sector, stock or ETF to a benchmark like the S&P 500. When it is rising the sector or stock is performing better than the S&P 500. When it is falling then the sector or stock is weaker and should be avoided.
The weekly chart of the Consumer Staples Select had a low near $12 in 2003 and then rallied to over $22 in 2008. It dropped sharply along with most stocks in 2008. The RS declined from late 2002 through November 2007, line b. This was an indication that XLP was weaker than the S&P 500 and should have been avoided during the bull market
That changed just after the stock market peaked In October 2007, line a as the RS overcame its downtrend (line b) after rising for two years, line c. The RS rose sharply indicating XLP was a market leader until it peaked at the end of February 2009. That was one week before the stock market bottomed. That was a sign that XLP was unlikely to be a winner in 2009. It finished ninth in 2009 and underperformed the S&P 500 by 10.6%.

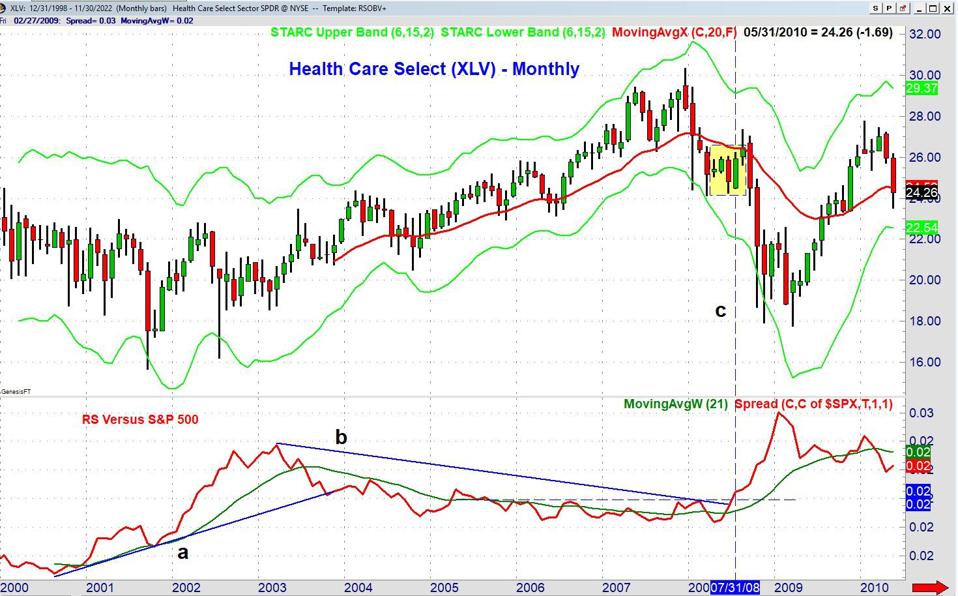
By monitoring and reviewing the longer term RS analysis of sectors or a sector ETF you may find that some markets underperform for an entire cycle. This was the case for Health Care Select (XLVXLV) during the bull market that began in 2002 and peaked in 2007.
The monthly chart of XLV reveals that it did not decline as much as some market sectors from the stock market high in March 2000 and the low in October 2002. The monthly RS turned higher in late 2000 and moved above its WMA in 2001. The RS stayed in a solid uptrend until early 2003 when it dropped below its WMA and then dropped below the support at line a.
From March 2000 until October 2002 XLV declined 12% while the S&P 500 declined 41%. Clearly, there was a large advantage in being in XLV over the S&P 500. During the same period, those who stuck with the Technology Select (XLKXLK) lost 76%.
This was consistent with the positive RS performance for XLV. From the high in early 2003, the RS for XLV declined for the entire 2002 to 2007 bull market. From March 2002 to October 2007 XLV rose just 43% compared to the 75% gain in the S&P 500 as the RS analysis indicated XLV was not a market leader.

During the initial decline of the bear market that led to the bear market rally in the spring of 2008, XLV started to perform better than the S&P 500. That was confirmed in July of 2008 when the RS overcame converging resistance and its WMA at line c. The RS rose more sharply and stayed above its WMA as the bear market ended in March 2009.
In the period from the October 2007 close to the March 2009 low the S&P 500 declined 53% versus a 34% decline in XLV. In contrast the SPDR S&P Bank ETF (KBEKBE) a leader during the bull market dropped 82.8%.
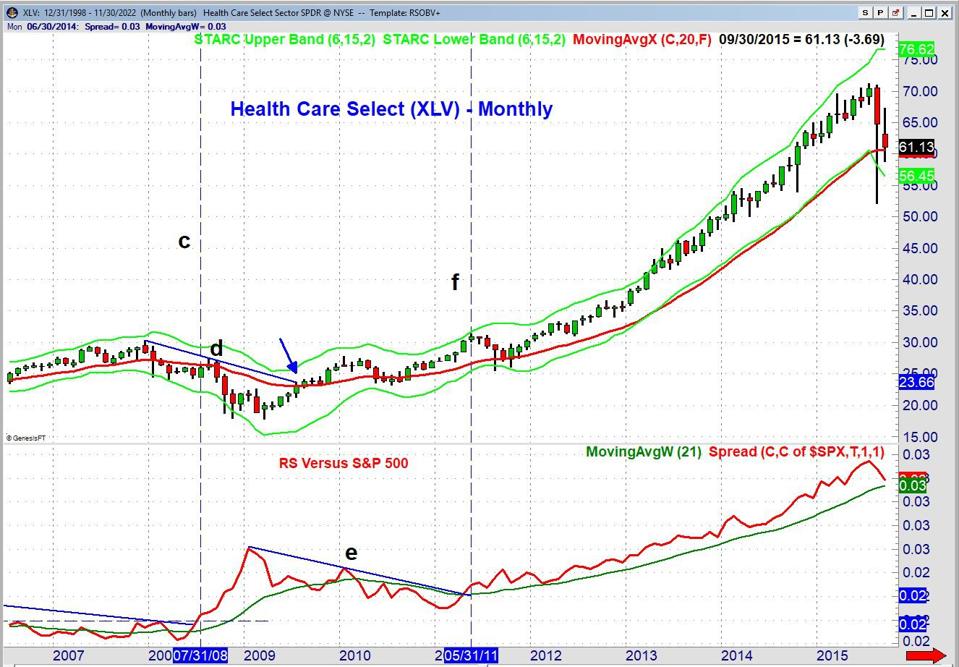
The RS for XLV declined from early 2009 until May 2011, line e, as it was not leading the S&P 500. The move above this resistance (line f) was a sign that Health Care was again ready to lead and it was a star performer for the four years!
From the earlier discussion the RS analysis turned negative on the Nasdaq Financial index ($IXF) in June 2007 just before the bull market highs in October. The RS analysis indicated that the financial stocks and especially the banks, which had led during the bull market were the still the stocks to avoid until late 2012.

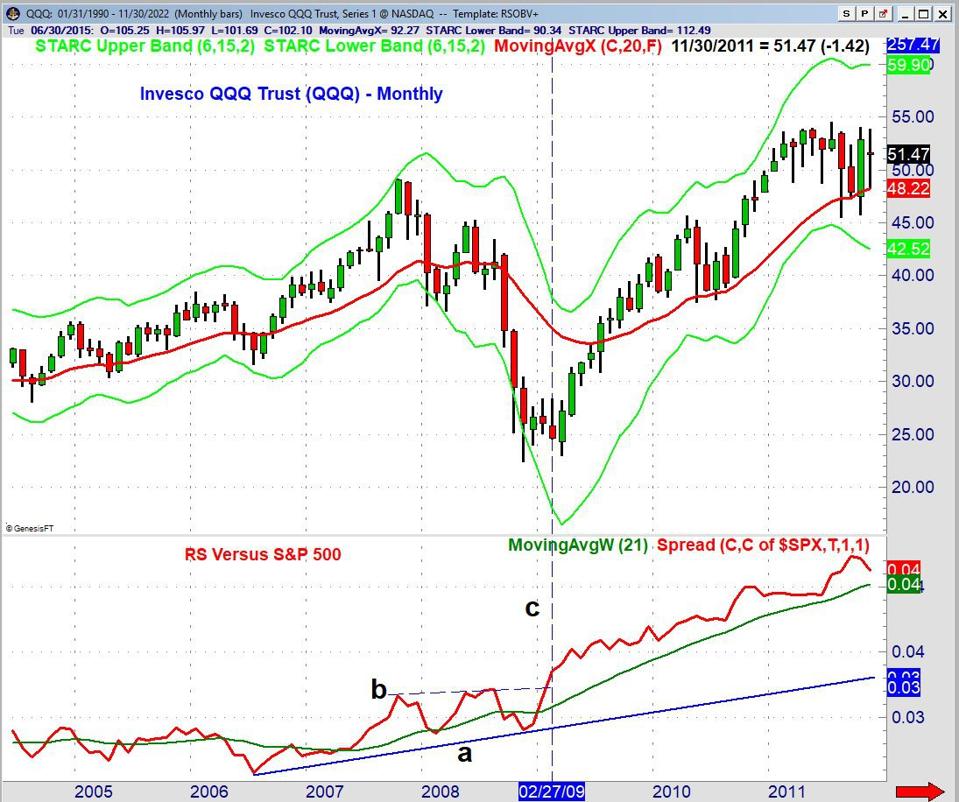
By the start of 2010 some disagreed with that view as they went back to the value stocks that had been the prior market leaders. By January 2009 I had noted that the QQQQQQ was diverging from the other market averages. QQQ peaked in December 2007 with a high of $49.12 and then dropped to a low of $22.41 in October 2008. A drop of over 50%.
The RS bottomed in 2006 and then formed a pattern of higher lows, line a, which indicated it was becoming a market leader. At the end of February 2009 (line c), the RS overcame the resistance at line b, which confirmed that QQQ was a market leader. As the S&P 500 made its low in early March, the QQQ made a higher low of $22.97. The S&P Information Technology Sector was the top performer in 2009. Of course, the FANG stocks have helped drive the market higher for the past In
In using the relative performance analysis to determine what ETFs or stocks to buy one needs to look at the RS on multiple time frames. For traders, deterioration in the daily RS analysis can help one decide to sell. The next installment, I will look at some new tools that I use to find the next market leaders.
Comments
comments