
A common problem for both investors and traders is that they buy too high and sell too low. Everyone at some time has picked a stock or ETF to buy only to see the market take off without them.
Often times the market will move up for several days in a row increasing the frustration and the urge to buy. Finally some will throw caution to the wind and buy only to see the market reverse back to lower levels which may stop them out.
The same pitfall can impact investors who hold on to a stock in their portfolio as it starts to fall. Selling out the position can mean that the investor has to "face up" to their mistake.
This is hard for anyone to do but finally when they sell out their position it will often rally 1-2% or more just after you get out.
Managing risk is a key factor in profitable investing or trading. If you can avoid selling near a short term low or buying near a short term high it will definitely improve your overall results.
"Starc bands" were developed in the mid-1980s by the late Manning Stoller, with whom I had the pleasure of teaching technical analysis in many cities around the world.
Starc stands for the "Stoller Average Range Channel," and by far, these are my favorite banding or channel techniques. It should be noted that they are interpreted much differently than Bollinger Bands.
The same formula is used on all markets and for any time frame and is as follows:
Starc+ = 6-period moving average + (2 x 15-period Average True Range) (ATR)
Starc- = 6-period moving average - (2 x 15-period Average True Range) (ATR)
The Average True Range (ATR) was developed by Welles Wilder and a fifteen period ATR is used for starc bands.
The beauty of the starc bands is that unlike most indicators or methods, they can tell you when it is a high- or low-risk time to buy or sell. Using two times the ATR, Stoller estimated that 90% of the price activity should stay within the bands.
Starc+ and Starc-
As for interpretation, if prices are near the "starc+" bands, it is a high-risk time to buy and a low-risk time to sell.
Conversely, when prices are near the "starc-" band, it is a low-risk time to buy and a high-risk time to sell if the other technical indicators agree with the starc band warnings.

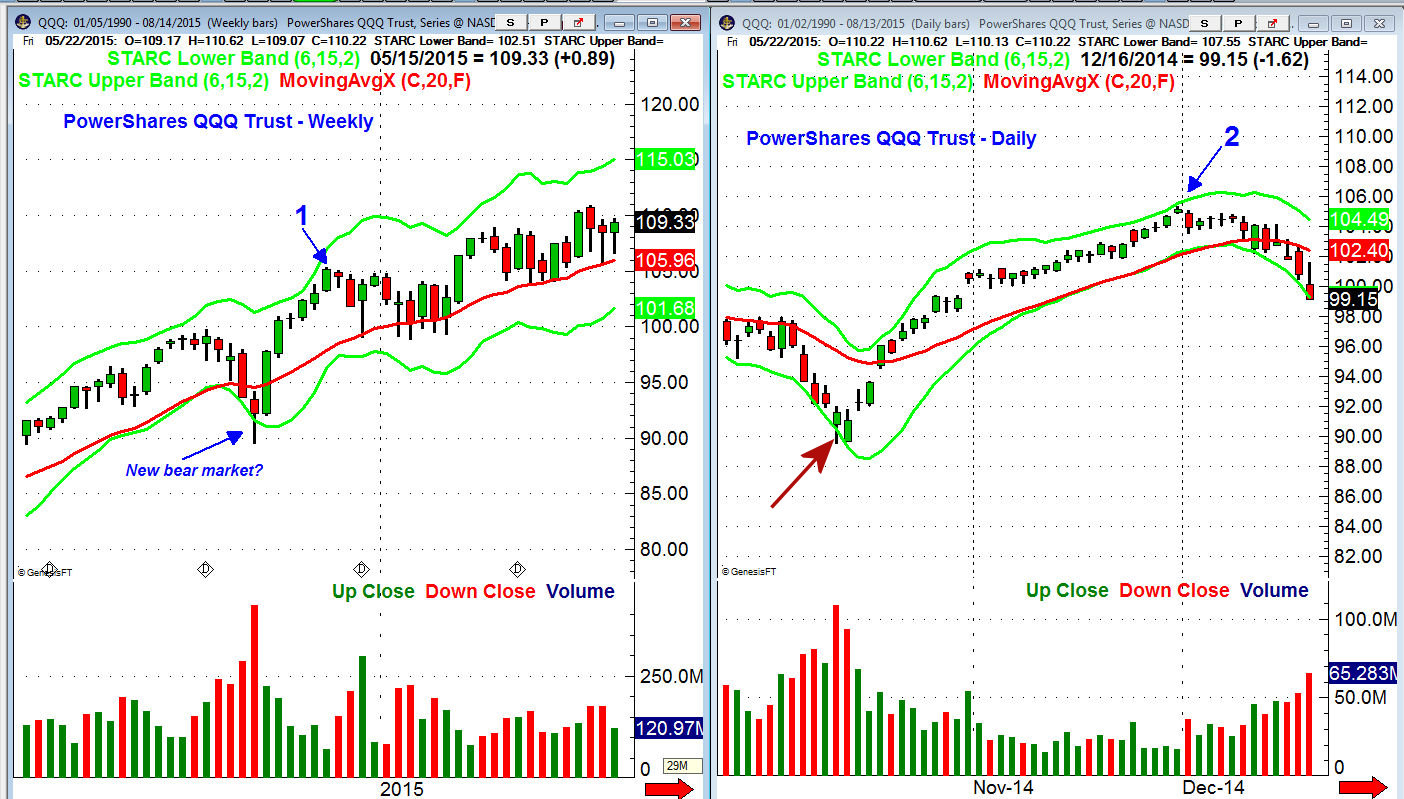
Many of you may remember the stock market action on Wednesday October 15th when stocks and bonds were both plunging in early trading. At the time several well know media analysts had just proclaimed the start of a new bear market.
The PowwerShares QQQ Trust (QQQ) had closed on the lows the previous Friday at $93.66. The lower starc band (starc-) for the following week was not much lower at $93.08. The low early Wednesday at $89.42 was 4.5% below the weekly band.
The daily chart of QQQ on the right shows that it had also closed near the daily starc- band (see arrow). The lows on both Wednesday and Thursday exceeded or tested the starc- band. Though there were no clear signs of a bottom the fact that the QQQ was trading below both the weekly and daily starc- bands confirmed that it was a high risk time to sell or to establish new short positions.
The rally from these lows was relentless and on November 28th the QQQ closed at $104.88 (point 2) which was just above the daily Starc+ band at $104.80. Over the next twelve days the QQQ dropped 5.6% to close below the daily Starc- band.
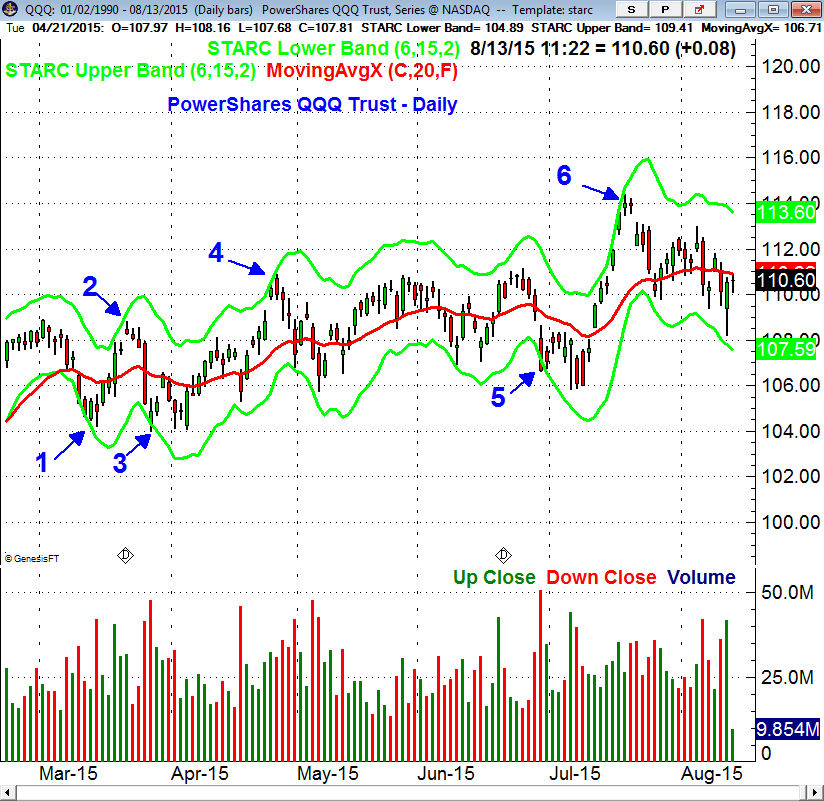
The daily starc bands can also give you quite a bit of insight even in choppy markets. The PowerShares QQQ Trust (QQQ) closed at a new high on the first day of trading in March 2015 before declining for the next eight days.
This correction took prices to the starc- band for three consecutive days, point 1, before the QQQ turned higher. After three strong days on the upside some may have been tempted to buy but the rally topped out just two days later (point 2).
Over the next four days the QQQ lost over 3% to close on the daily starc- band. The lows held on a retest in early April before the QQQ started a three week rally. On both April 24th and 25th the QQQ reached the starc+ band (point 4) and even though prices had surpassed the March highs the starc band analysis warned it was not the time to buy.
In the next seven days of trading the QQQ dropped 3.8% and came close to the starc- band before developing a range that lasted until late June when the starc- band was tested for two consecutive days (point 5). The QQQ moved sideways for three days, a normal reaction after the starc- band is tested, before dropping to marginal new lows.
The rally from the lows was impressive as the Nasdaq 100 and the Nasdaq Composite both made new highs on July 20th as the starc+ band was tested (point 6). The new highs in both averages received considerable attention in the media that could have tempted some to buy.
The Nasdaq 100 Advance/Decline line had peaked in May and had formed lower highs in June. As I pointed out on July 21st ("Narrow Advance Warrants Caution" ) the A/D line just reached its downtrend which was key resistance. This was a sign of weakness as it indicated that just a few stocks were pushing the Nasdaq 100 to new highs.
Often when one sees an extreme price the tendency is to take action which often results in one getting in or out at the worst price. The panic open on August 24th briefly pushed many ETFs to absurdly low prices in the first few minutes of trading. There were several stories in the press about financial advisors who sold on the opening as the wide swings were apparently the result of the inability to price individual components of many ETFs.
On August 24th the Spyder Trust (SPY) dropped below the monthly, weekly and daily starc- band as it hit a low of $181.46 which was 5% below the monthly starc- band at $191.00. This was the most extreme reading since 2011. As of last week's high the SPY had rallied over 11% from the August 24th low. For the week of September 20th the weekly starc- band stands at $188.72 with the daily at $192.46.
The formula for the starc bands is quite straightforward, it is not difficult to add it to most charting packages. In some cases Keltner channels can be modified to produce starc bands. First the moving average will need to be changed to six with two ATR added to or subtracted from this moving average.
I use these bands in both my investing and trading as I even run it on the mutual funds in my 401(k). I also use the bands to help determine a limit price to enter or exit a position.
As with any good indicator, I suggest that you work with it first, study it on several markets, and convince yourself that it can help you before using it on a real-time basis.
The Starc bands levels play a major role in my recommendations for both stocks and ETFs as they are often referred to in my Viper Reports. The Viper ETF Report provides specific buy and sell advice for traders as well as investors on both market tracking and sector ETFs
If you are a stock trader I typically make 1-3 new recommendations each week on either the long or short side in the Viper Hot Stocks Report. Each service is updated twice a week and is only $34.99 each per month. The subscription can be cancelled on line at any time.
New subscribers also receive four of Tom's most recent trading lessons which are sent out regularly to subscribers.
Comments
comments