Volume analysis has played an important role in my analysis for over 30 years. It can be traced back to my discovery in the late 1970s of the late Joe Granville’s book New Strategy of Daily Stock Market Timing for Maximum Profit. In this book he wrote “stocks do not rise in price unless demand exceeds supply. Demand is measured in volume and thus volume must precede price.”
Over the years, I have explored the OBV in more detail and written extensively about multiple time frame analysis of the OBV in the past few years. In identifying both bottoming and topping formations in stocks or ETFs the relationship of the OBV to its 21-period weighted moving average plays important roles. The weekly and daily OBV play an important role in the stock scans I use to recommend stocks in Viper Hot Stocks.
Related: The 20 Habits of Wealthy Traders
This because you will not always see positive or negative divergences at a major turning point. At a market bottom divergences can be explained by a transition where the demand starts to gradually exceed supply as prices reach a low point.
Negative divergences at a top are a result of the fact that fewer buyers (lower volume) are pushing prices higher. Of course the OBV does not always warn you of tops or bottoms but with so many instruments to trade or invest in the OBV can often lead prices up or down which can help give you an edge.
The July drop in the stock of Apple, Inc. (AAPL) after its earnings were released caught many by surprise. My OBV analysis of the stock as of July 24th highlighted the negative weekly and daily OBV signals that preceded that drop and also projected a further price decline.
Before I look at the current OBV analysis of AAPL lets look back at what the OBV was projecting in July as it is an excellent example of how the OBV can lead prices both higher and lower.
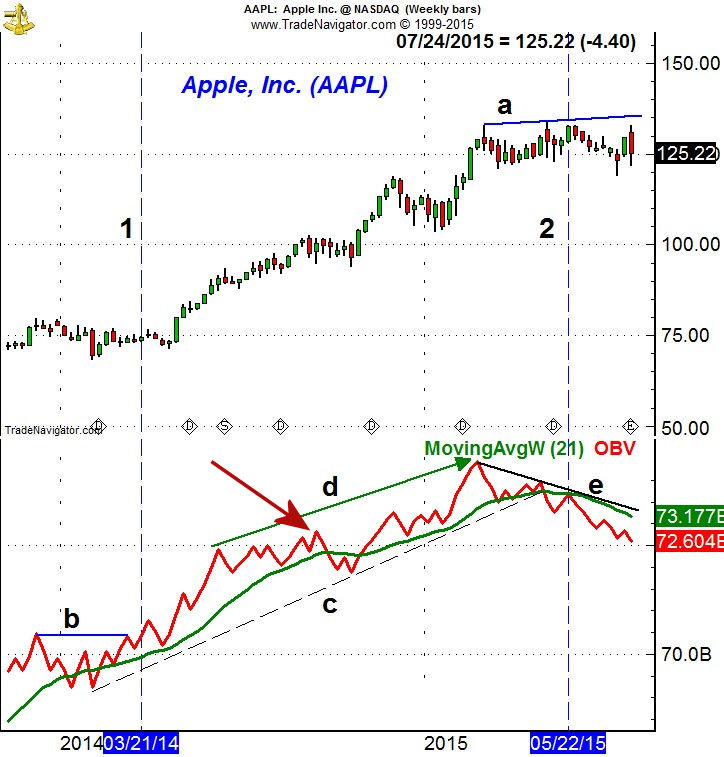
The weekly chart covers both the sharp rally in 2014 as well as the trading in 2015. On March 21, 2014 (line 1), the weekly OBV broke through resistance at line b as it started to lead prices higher. The OBV had been above its 21 week WMA since early February 2014. The stock price did not break out to the upside until five weeks later so the improving OBV was an early sign the stock was accumulation
The stock consolidated in November 2014 as the OBV dropped briefly below its WMA. The OBV had confirmed the prior high so this was likely a pause in the intermediate uptrend. On the daily chart a clear continuation pattern formed (see daily chart below) which set up another good buying opportunity.
Using the two 2014 lows the OBV had formed a clear uptrend, line c, that stayed intact until the first week of May. The OBV also made a series of higher high, line d, as it was confirming the price action. This changed on May 5th 2015 as the new weekly high was not confirmed by the OBV. The negative divergence, line e, should have put investors as well as traders on notice that the trend was likely changing.
The decline the next week dropped the OBV below the prior low creating a new downtrend in the OBV. This confirmed the divergence and the following week the OBV just rallied back to its now flat WMA (line 2). This I have found to be a quite reliable topping formation. The decline in the OBV below the prior lows established the downtrend, line e, as key resistance.
When you combine the weekly analysis with the daily charts and technical studies you are better able to trade the shorter term trends while also being alerted earlier to any changes in the major trend.
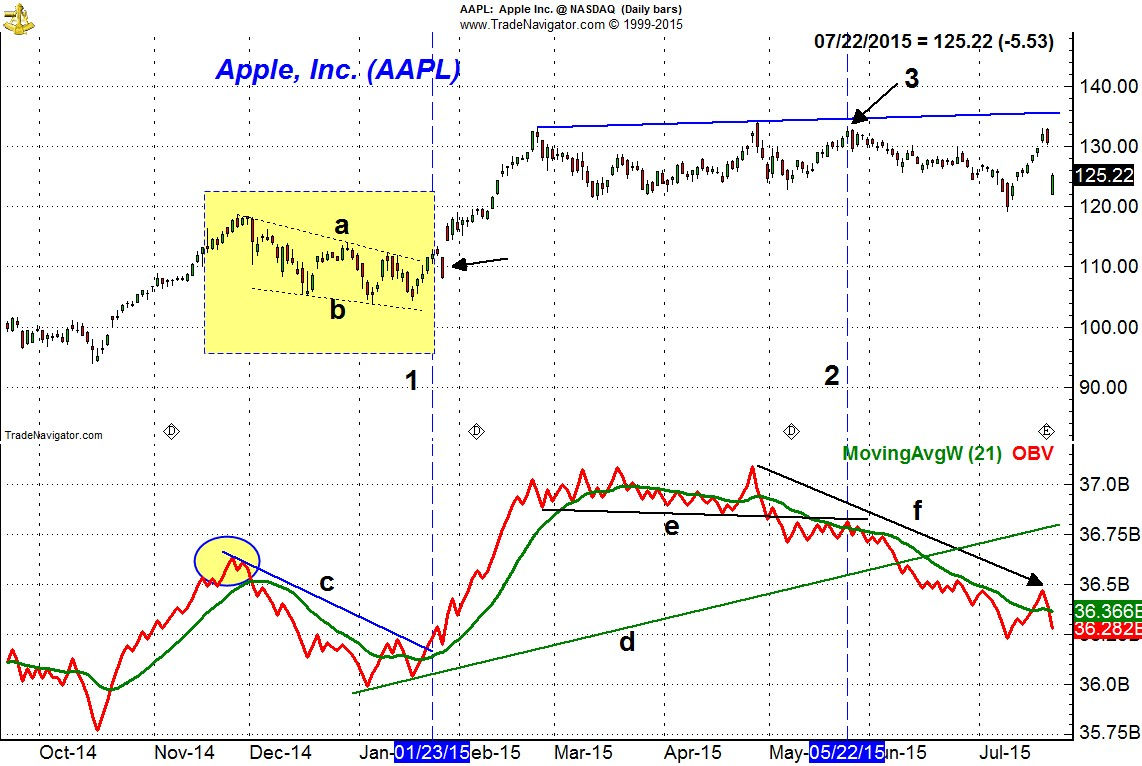
In October 2014 the daily OBV moved back above its WMA as APPL rallied from the $101 level to a high near $119 just before Thanksgiving. The OBV formed a slight negative divergence, based on the daily closing price, at these highs, line c. This was now the key level of resistance to watch.
The chart of $APPL shows that it formed a flag formation (lines a and b) over the next seven weeks. This formation was completed on January 22nd and the following day the OBV (line 1) had clearly overcome the bearish divergence resistance at line c. This created a buying opportunity as the company was scheduled to report earnings after the close on January 27th.
Before the opening on January 27th I reviewed the monthly, weekly, daily and 240 minute charts of $AAPL and recommended buying $AAPL on a pullback even if it came on an earnings miss. Instead the stock declined ahead of the earnings and reached the initial buy level. The earnings were strong and $AAPL gapped sharply higher the next day.
The daily OBV stayed strong until the middle of March as it then developed a trading range that ended on April 28th when it made a marginal new highs. The OBV support that developed in March and April, line e, was broken in early May.
As $AAPL rallied to a new daily closing high on May 22nd, point 3, the OBV stayed below its declining WMA (line 2) and was much lower than it was in late April. This was a sign of weakness that was confirmed on June 9th as the daily OBV support, line d, that went back to the January lows was broken. The lower lows in the OBV were consistent with a new downtrend which that was negative.
The rally from the July 9th lows was accompanied by lower than average volume as the OBV just rallied briefly above its WMA but was not able to overcome the OBV resistance at line f. In July I noted that $AAPL as well as the OBV needed to rally above the recent peak and the late June highs to suggest the worst of the selling was over.
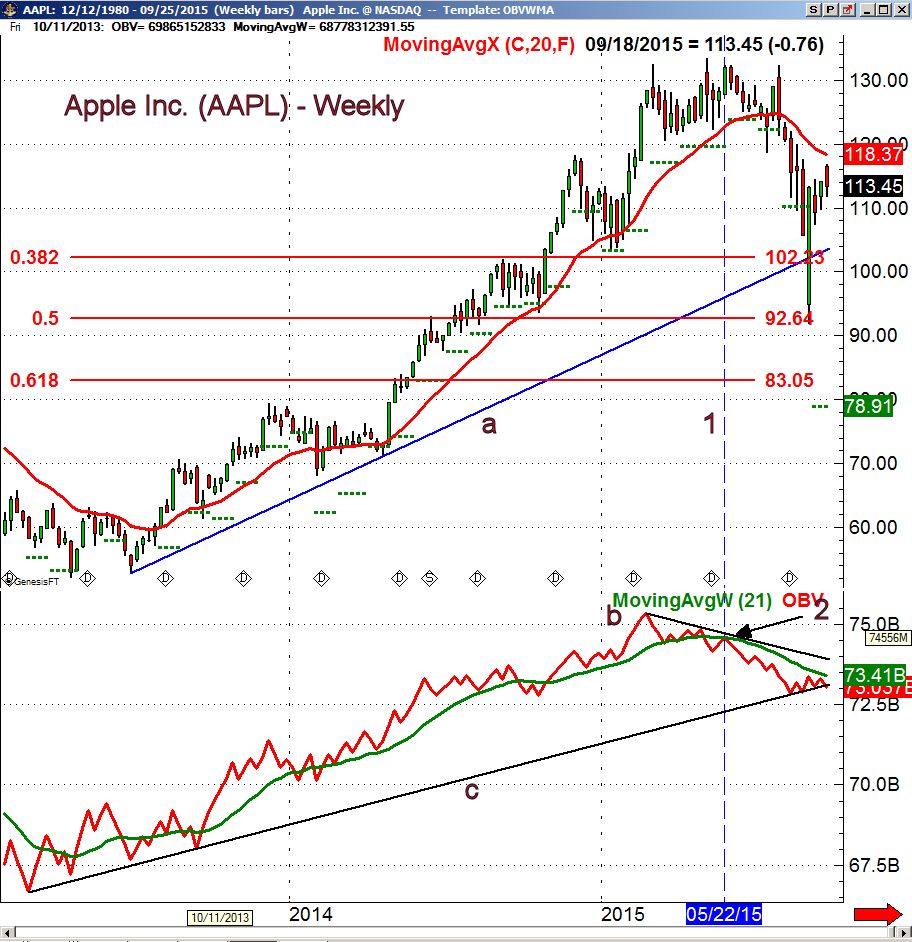
Over the past two months $AAPL has continued to move lower and as of the close on September 18th it is down 10.5%. On August 24th it plunged briefly to a low of $92 which was slightly below the 50% Fibonacci retracement support at $92.64. This was derived from the from the 2013 low with the 61.8% support at $83.05.
The uptrend from the 2013 lows, line a, was also broken on the decline though AAPL closed the week above this support. The rebound from the lows appears to have failed below the 20 week EMA which is now at $118.37.
The weekly OBV has barely rallied with prices as it is trying to hold the longer term support at line c. The OBV is still below its declining WMA as well as the major bearish divergence resistance at line b.
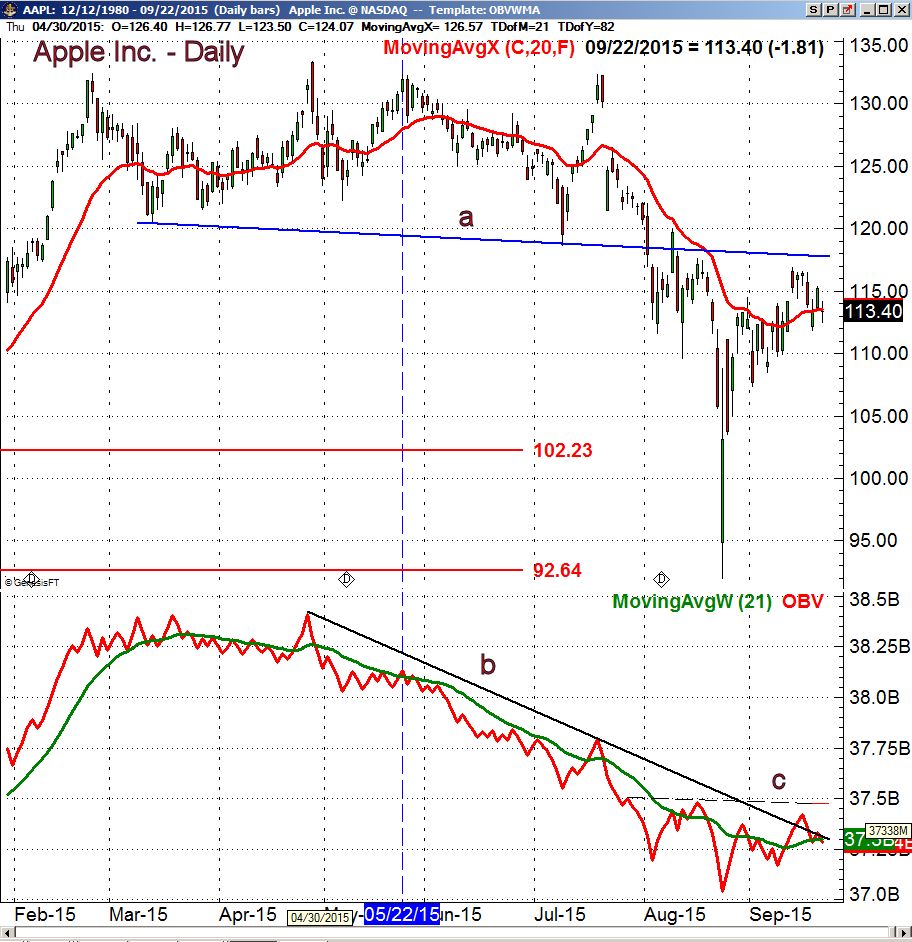
The daily chart shows that there is important chart resistance in the $117.50-$118 area (line a) which connects the March and July lows. It is not surprising that the rally last week appears to have stalled at $116.89. The key support is now in the $110 area and if it is violated we should see another wave of selling.
The daily downtrend in the OBV, line b, was slightly overcome last week. The OBV has since turned lower and as of the close on September 22nd is now just below its WMA. There is more important OBV resistance now at line c, which corresponds to the late July and the August high. A strong move above this level is needed to turn the short term outlook positive.
This type of OBV analysis can be used on stock, futures and ETFs. The OBV is available on most free platforms and here are my suggestions on how to use it systematically
1. Monitor the weekly and daily OBV trend lines
2. Watch the relationship of the OBV to its WMA on multiple time frames.
3. Determine whether the WMA is rising or falling.
I will be adding additional examples of the OBV analysis in the coming months and will continue to post OBV charts on both Twitter and StockTwits.
Comments
comments