
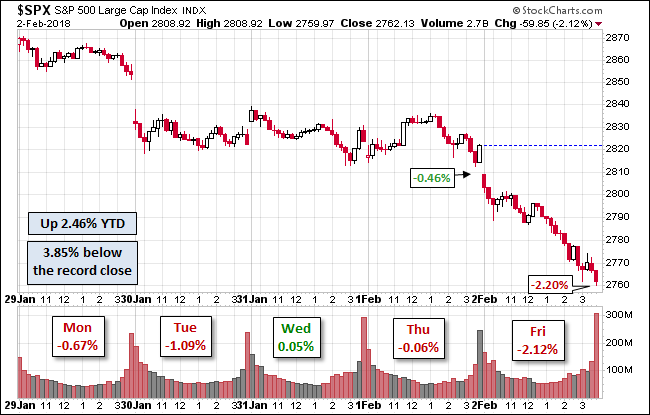
The sharp drop in the major averages Friday added to the week’s woes, as the Dow Industrials was down over 4% and the S&P 500 lost 3.9% for the week. All eleven S&P sectors were lower. The relentless selling was evident from the weekly NYSE A/D numbers, as only 283 stocks advanced and 2821 declined.


After last week, many investors are likely to be on edge, especially those who just got into the stock market this year. Even the Super Bowl weekend is unlikely to keep many from worrying about the stock market. It is too early to tell how many of the new buyers will exit the stock market, but I would urge them to view last week’s action from a historical perspective.
It is important to understand that the stock market’s performance in 2017 and early 2018 has not been normal. In “Bulls Stampeding – What’s Your Strategy”, I pointed out that there had been only three times, 1965, 1994 and 1996 when the S&P has gone 370 days without a meaningful correction. The winning streak in 2017 and 2018 has been much longer, so last week's correction was not surprising.
As we started the year it seems many new investors were expecting that with the tax cut and booming economy that 2018 was going to be another buy-and-hold year. From my historical perspective, that was going to be unlikely, as I discussed in “Investing Or Trading In 2018?”. I thought 2018 was more likely to be a more volatile year. The action last week supports that view.
Most are blaming the market’s plunge on fears of a “bond bear market” as the spurt in wage inflation Friday caused another surge in yields, giving bond holders a new reason not to like bonds. Many investors still think rising rates must be bad for stocks and ignore the evidence to the contrary.


This chart of the yield on 10 Year T-Notes (in pink) and the S&P 500 (in blue) goes back to 1998. I think it is helpful to view the current action in terms of the past activity. The yield on the 10 Year T-Note has risen from a low of 1.458% in June 2016 to the current yield of 2.854%.
In September 1998 the yield had a low of 4.41% and by January 2000 it had risen to 6.67% (line 1). During that same period, the S&P 500 rose from 957 to 1517, a gain of 59.5%. The 2.26 percentage point increase in yields took 16 months from bottom to top then, and it has now been 20 months since yields bottomed in 2016.
In 2004, the Fed also started raising rates (line 2), and from a low of 3.35%, they peaked at 5.138% in May 2006. Of course, the stock market continued to move higher until it topped in October 2007. From the chart, you will also notice that the long term downtrend for 10 Year T-Notes (line a) has now been broken. This is consistent with a potential reversal of the multi-year downtrend.
Many are fearing that yields will move above 3% and from a technical perspective that is likely, probably this year. If yields move above 3% there is strong yield resistance in the 3.30%-3.40% area. Since MIT offered a 100 year bond back in 2011, I have been concerned that many bond holders may not understand that a capital loss in their bonds could be much greater than their yield.
For those theorizing that bond yields are rising because of increased inflationary pressures (and not an ever-improving economy), the 5.8% drop in nickel and over 1% decline in gold futures last week must have been a surprise. With so many focused on fears of the bond bear market, the question must be asked: Where are the bond investors going to invest once they sell? It seems likely that some of the proceeds will flow into stocks.
If you contributed to the recent $100 billion inflow to stock funds or ETFs, the headlines about the largest weekly decline in two years may have you worried. The general assumption is that some of this new buying came from those who have avoided the stock market for the past few years because of the “wall of worry”.
I have been arguing against the wall of worry for many years including the January 2013 (Scaling The Wall of Worry) and in February of 2016 when I urged investors to ignore the Wall of Worry. It has been my view that the prevailing bearish opinion on the economy and the stock market over the past few years has kept investors out of stocks when both prices and the risk was low.


The weekly chart of the Spyder Trust (SPY) shows the powerful reversal from the high two weeks ago, which took prices well above their starc+ band. The SPY had been above its weekly starc+ band for a month, which meant it was in a high-risk buy area. Managing risk is a key to successful investing, and last week I cautioned investors “Don’t Let The Euphoria Change Your Plan.”
So what do the charts say about the current correction? The weekly close below the two-week low in the $280-area has Wall Street focused on the $268- to $270-area which is about 2% below Friday’s close. The 50-day SMA is at $270.66, and a close below that level is likely to turn more traders bearish.
The weekly starc- band is at $267.98 and the 20-week EMA, generally a good measure of long term support, is 3.6% lower at $265.20. If this level were hit it would be a decline of 7.4% from the high. The the long term uptrend (line a) and the quarterly pivot are in the $261-$262.25 area.
The weekly S&P 500 A/D line has turned lower but is still well above its WMA. It last dropped below its WMA in the spring of 2017 (shaded area) but the following week it reversed back above its WMA. The fact that the weekly A/D line made new highs a week ago is consistent with a correction, not a major top.


The technical situation is much different than it was in late 2015 and early 2016 when the S&P 500 had the most recent sharp declines. The week ending January 8, 2016 (point 1), the SPY dropped 5.8% and it lost another 2.1% the next week.
In late 2015, there was a 3.7% weekly decline (point 2) and a 3.6% weekly drop in November (point 3). All of these were preceded by the 5.6% plunge in late August of 2015 (point 4). It is important to understand that the weekly A/D line had formed a bearish divergence in May of 2015 and was in a downtrend (line a).
During the summer of 2015, I warned traders and investors to be patient and not to do new buying until the following three criteria were met. They were reiterated just after the market’s collapse in August, “Stick With June’s reason To Stay Patient.”
- Wait for clear signs from the A/D lines that the correction is over.
- AAII bullish% now at 35.6% needs to drop to the low 20% area.
- The percentage of S&P 500 stocks above their 50-day MA needs to turn up from the 20-25% level.
These criteria were not fulfilled until February of 2016 as the AAII bullish sentiment had dropped below 20% and the A/D lines overcame resistance. This week’s AAII survey should be interesting, as the bullish % was at 44.8% last week and could get hit this week.


The extreme bullish sentiment and overbought readings for all the major averages were the only real warnings of the correction at the start of last week. In Tuesday’s market update for Viper ETF and Viper Hot stock subscribers, the chart above was provided. It showed that the NYSE A/D line had dropped below its WMA. Even more interesting, the number of NYSE stocks making new lows had surged to 204 which was (at that point) the highest reading since November 14, 2016.


The updated chart shows that 346 stocks made new lows on Friday. The NYSE Composite has already reached the 38.2% support from the November lows with the 50% support at $12,909. This is just below the monthly pivot support at 12,927. The quarterly pivot is at 12,626.
In my weekend review of the ETFs that I monitor for the Viper ETF report, I will paying close attention to those that closed the week below their quarterly pivots. This analysis should give some additional insight into which ETFs could be the new leaders once the correction is over.
The daily A/D line has moved further below its WMA since Monday, and the WMA is now declining. This means it is in the corrective mode, with next strong support at lines a and b. The end of the correction will be signaled when the A/D lines bottom out and they move above resistance.

Even the good earnings could not support the PowerShares QQQ Trust (QQQ), as it was down 3.7% last week. It closed below the daily starc- band with the 38.2% support from the August lows at $159.01. The 50% support is at $155.30 with the quarterly pivot even lower at $153.15.
The Nasdaq 100 A/D line did not drop below its WMA until Thursday’s close. Its WMA is flat and it has long term support at line a. The QQQ has initial resistance now in the $167-$168 area.
What about the economy?


The majority of bear markets occur during a recession, and all of the economic measures I follow show no signs yet that the economy is getting weaker. In fact, they continue to indicate it is getting stronger. One of my favorites is the Conference Boards Leading Economic Index. It is a composite of ten economic indicators. The chart above, from Advisor Perspectives, shows that the Index typically tops out well before a recession.
The insert shows that the index has been in a powerful uptrend for the past year. Therefore it would take six months or more of deterioration in the economy before it could top out. Jeffrey Schulze from Clearbride Investments agrees, as of the twelve variables in their economic model, “only one of them is flashing any type of caution.”
So in answer to my original question – the stock market is not on thin ice. It is likely, however, that the worst of the selling is not over, and you can expect another few weeks of selling before the trend moves back upwards. The good news is that my analysis of last week’s selling makes a 1-2% rally very likely this week. This should tell me more about how long the correction is likely to last. Stay tuned via Twitter @TomAspray.
Both the Viper ETF and Viper Hot Stocks reports are sent out twice a week. They include in-depth market commentary including the A/D line analysis and specific recommendations. Each report is only $34.95 per month.
Comments
comments