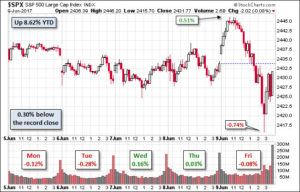
There have been a number of analysts warning about how June can be a tough month for stocks. Friday’s sharp drop in the tech stocks with the Nasdaq 100 losing 2.44% ended up being a stampede as a note from Goldman Sachs helped to scare investors.

In a CNBC article last week the well-respected Art Cashin focused on the fact that as stocks are going up so are bonds. He wonders whether yields are moving lower because the economy “isn't as robust as anticipated, and he pointed to mounting jitters that economic growth could fall back below 2 percent. “ The 10 Year T-Note yield closed at 2.204% well above the panic level.
S&P 500 Change
2015 -2.16%
2013 -1.56%
2011 -1.83%
2010 -5.20%
2009 -0.43%
The Dow Industrials have not done well in June over the past twenty as according to “Bespoke Investment Group, June has been a down month for the Dow 60 percent of the time”. Looking at the S&P 500 since 1950 there have been 34 up years and 33 down years with an average return of -0.09%. Since 2009 the S&P 500 has closed lower in June five times (see table) with the worst a decline of 5.2% in 2010.
Are there any similarities to the past June charts and this year? Should you change your strategy?
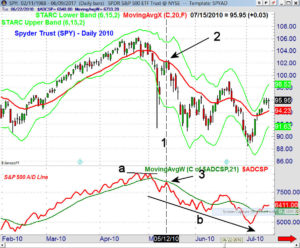

In 2010 the Spyder Trust (SPY) made a slightly higher high on April 26th and then dropped sharply the following day. The S&P 500 A/D line was stalling at the time, line a, and then dropped below its WMA six days after the highs. The selling accelerated over the next few days with the flash crash on May 6th as the Dow plunged 998 points in 36 minutes of trading.
The SPY dropped below its starc- band also on the following day before staging a four day rally that took the SPY back to its declining 20 day EMA, point 2. On the rally the S&P 500 A/D line just rallied back to its now declining WMA, point 3, before it again turned lower.
This set the stage for the decline in June as after the oversold rally ended on June 21st the SPY dropped to new correction lows. The A/D line had continued to form lower low, line b, consistent with a market decline.


In 2013 the Spyder Trust (SPY) peaked on May22nd as it had spiked to a new rally high but then closed lower. The SPY tried to bounce for a few days before it again turned lower. The A/D line formed a slight negative divergence at the highs, line c, and six days after the highs it was trading below its WMA. The support in the A/D, line b, was broken on June 6th (line 1)
There was a rebound in mid-June before the decline resumed as SPY had a low on June 24th of $145.09. This was below the monthly pivot support and the daily starc+ band. The downtrend in the A/D line was broken on June 27th (point 2) signaling that the correction was over.
The pattern was quite similar in 2015 as the A/D topped out in May and there was also a strong rally that ended on June 23rd. The market consolidated during July but as I warned in early July (“The Week Ahead: Should You Trust This Rally?) the market was vulnerable.
I pointed out to investors and traders that “The NYSE weekly A/D line dropped below its WMA on Friday June 5th and it has continued to make lower lows.” My views were summarized by this conclusion “The completion of the weekly rising wedge formation in the iShares Russell 2000 (IWM) is another piece of negative technical evidence. Therefore the weight of the evidence indicates this is a rally that you cannot trust.”
The decline culminated the morning of August 24th as the Dow dropped 1100 points just after the open. The selling had started in China over concerns about its economy. The Dow closed down 588 points and did not complete a short term bottom until October.
The decline in 2011 was also preceded by the A/D lines topping out and as I discuss in the Market Wrap section the A/D lines are currently much stronger now than there were prior the previous June decline.
The Economy
In last Monday’s data the PMI Services Index and the ISM Non-Manufacturing Index were both just a bit lower than expected. These reports have been strong since last summer and as Econoday commented after the report “This is a very solid rate of growth that reflects strength in business activity”.
The focus this week will be on the FOMC meeting that begins on Tuesday with the announcement and Fed Chair press conference on Wednesday afternoon. On Wednesday we also have the Consumer Price Index and Retail Sales. There may be more focus on the CPI this month as the Fed is apparently concerned over the sluggish rate of inflation.
The Philadelphia Fed Business Outlook Survey, the Empire State Manufacturing Survey, Industrial Production and the Housing Market Index will be released on Thursday. The week ends with quadruple witching, Housing Starts and Consumer Sentiment on Friday.
Interest Rates and Commodities
The yield on the 10 Year T-Note dropped to a low of 2.133% on Tuesday but then rebounded to close at 2.199% as it reached the declining 20 day EMA. Both the weekly and daily studies are negative but the daily momentum shows possible signs of bottoming but it will take time.
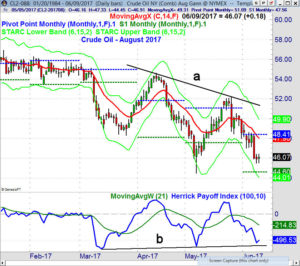

Crude oil dropped 3.7% last week after testing the monthly pivot at $48.41 for several days. The monthly pivots have been lower each month since March which is “A Simple Way To Find Trending Markets”. It is too early to tell whether the monthly pivot will be higher in July as it is based on June’s data.
There is monthly pivot support at $44.60 with the daily starc- band at $44.01. The Herrick Payoff Index (HPI) which uses price, volume and open interest dropped below the zero line and it’s WMA at the end of May. The HPI is now close to support from March, line b, but it needs a strong rally before it could bottom.
Market Wrap
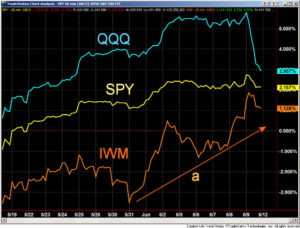

Nervous holders of tech stocks headed for the exits on Friday which one of the most split markets I have seen in some time. The reversal is very clear on the 60 minute chart of the PowerShares QQQ Trust (QQQ), Spyder Trust (SPY) and iShares Russell 2000 (IWM). The QQQ dropped below the prior three day lows just after noon as the heaviest selling occurred in the next ninety minutes. The SPY stayed in its recent range after dropping from the early highs.
The iShares Russell 2000 (IWM) started to diverge early in the month as it was acting stronger than the other averages, line a. Even though neither the IWM of the Russell 2000 was able to close above the breakout level from Friday’s column “Unloved Sector Ready To Break Out?” they continue to act positive and could breakout this week.
In Friday’s wild action the Nasdaq Composite dropped 1.8% but did better than the 2.44% decline in the Nasdaq 100. The S&P 500 closed just a bit lower and the Russell 2000 gained 0.43%. The Dow Industrials rallied late in the day to close positive and at a new all-time high along with the NYSE Composite.
The daily A/D numbers were positive Friday on the NYSE, S&P 500 and Russell 2000 but negative on the Nasdaq 100. For the week the NYSE A/D numbers were just slightly negative. There was also a wide range in many of the sectors as the Philadelphia Oil Service Index was up 3.7% and the KBW Bank Index was up 2.3% but the Philadelphia Semiconductor Index lost 4.2%.
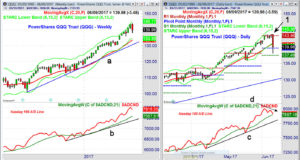

The focus is clearly on the PowerShares QQQ Trust (QQQ) as the action does not look like much on the weekly chart. The next weekly low is at $135.87 with the rising 20 week EMA at $133.42. There is chart support at $130, line a, with the quarterly pivot at $128.
The daily chart shows Friday’s wild action though the low at $138.11 was above the monthly pivot support at $137.49. This is the next level to watch this week. The QQQ had been testing the monthly pivot resistance at $143.46 for over a week (point 1) before it dropped. There is resistance now in the $142 area.
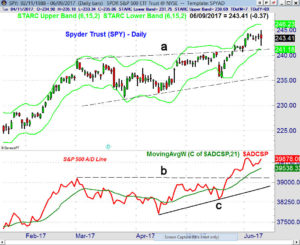

The daily chart of the Spyder Trust (SPY) still looks strong as it closed at $243.41 well above Friday’s low at $141.95. The breakout level, line a, and the daily starc- band are at $241.18. The daily starc+ band is at $246.23 with the weekly at $248.40. There are still trading range targets at $150.
Both the weekly and daily S&P 500 A/D lines made new highs the week of June 2nd. The A/D line turned up last Tuesday as it rallied steadily into the end of the week. It is still holding well above its rising WMA and good A/D line support at line a. A sharp drop in the A/D line below its WMA would be the first sign that a top may be forming.
For iShares Russell 2000 (IWM) both the weekly and daily Russell 2000 A/D lines are in clear uptrends as the weekly has moved further above its WMA. IWM moved above the breakout level on Friday but was not able to close above it.
The SPDR Dow Jones Industrial (DIA) was up 0.31% last week and the A/D lines both made new highs. The daily relative performance analysis indicates that DIA is now leading the S&P 500 higher.
What to do? The extremely overextended technology stocks finally had their very overdue correction last week. Though there may be some follow through selling early in the week it is too early to suggest that a significant top is in place. It is more likely that Friday’s drop in the technology sector will be a buying opportunity. It may take some time before the tech sector is ready to resume its uptrend.
Viper ETF traders sold out longs in both the Technology Sector Select (XLK) and the First Trust Dow Jones Internet (FDN) a few weeks ago for nice double digit profits. There are a number of sectors that look strong as they have held up well after completing their trading ranges.
The strength of the beaten down small cap, bank and energy stocks indicates that as the tech sector consolidate we are going to see more sector rotation. This creates new buying opportunities.
Viper Hot Stock traders took some profits early last week but other of our long positions have pulled back to their break levels. There were more new buy than sell signals in last week’s scan.
If you are interested in specific buy and sell advice you might consider a one-month investment of just $34.95 for either the Viper ETF or Viper Hot Stocks service. Both services include two in-depth reports each week and subscriptions can be cancelled online at any time.
Comments
comments