

After many months of excruciating debate on a possible rate hike, the FOMC finally acted. Stock investors may have reacted even more bullishly to the Fed's apparent plan to raise rates gradually in the future. Plunging stock prices last week had turned the momentum negative and pushed many of the market measures into oversold territory.
The heavy selling turned individual investors more negative as the today's AAII survey reveals that the bullish% dropped 4.6% to 23.9%. This is the lowest reading since it hit 21.1% on July 30th. This was supported by a 9.5% rise in the bearish % to 39.4%. This is a positive sign for the market.
Wednesday's gains were impressive as the Dow Utilities led the major averages with a 2.7% gain. The small cap Russell 2000 slightly outperformed the S&P 500. The seasonal trend analysis for the Russell 2000 typically bottoms in late November but technically it has not yet completed its bottom formation.
Is this burst of upside momentum enough to push the market to new all time highs? The action the rest of the week will help us answer this question.
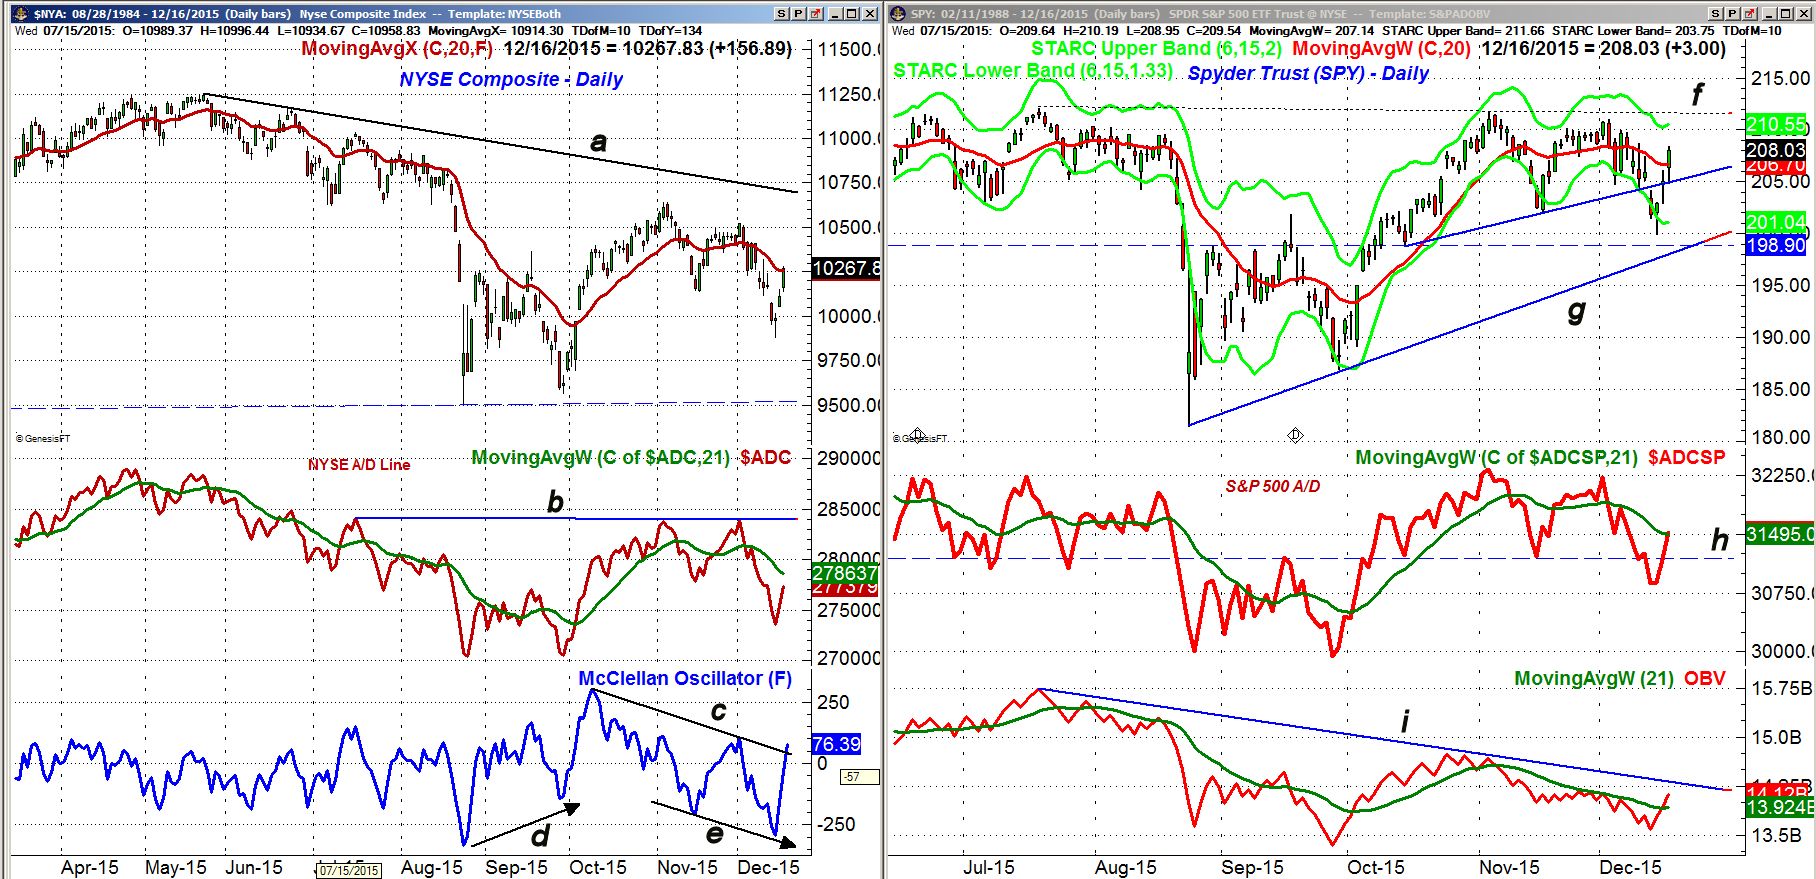
The NYSE Composite closed Wednesday barely above its 20 day EMA and a close above last week's high at 10,408 will be a positive sign. The prior swing high is a bit higher at 10,523 with the downtrend, line a, in the 10,700 area.
The A/D ratios were almost 5-1 positive as the A/D line has turned sharply higher but it still below its declining WMA. The recent drop under the November lows is still a concern and the A/D line needs to overcome the resistance at line b to signal a major bullish shift.
The McClellan oscillator hit -294 on Monday and closed Wednesday at 76 breaking the downtrend, line c. The lower lows in the oscillator, line e, is not typical of a market bottom. The bullish divergence at the October lows was typical of an important market low.
The Spyder Trust (SPY) managed to close well above its 20 day EMA at $206.70 and is now not far below last week's high at $209.73. The daily starc- band is at $210.55 and there is major resistance in the $212 area, line a.
The S&P 500 A/D line did drop below the October and November lows, line h, last week. The A/D line failed to make a new high at the start of the month and therefore is still in a short term downtrend. The weekly A/D line needs additional strength for the rest of the week in order to move back above its WMA resistance.
The daily OBV has moved back above its WMA but is still below the downtrend from last summer's high, line i. The intra-day charts show initial support now at $206.80-$205.60.
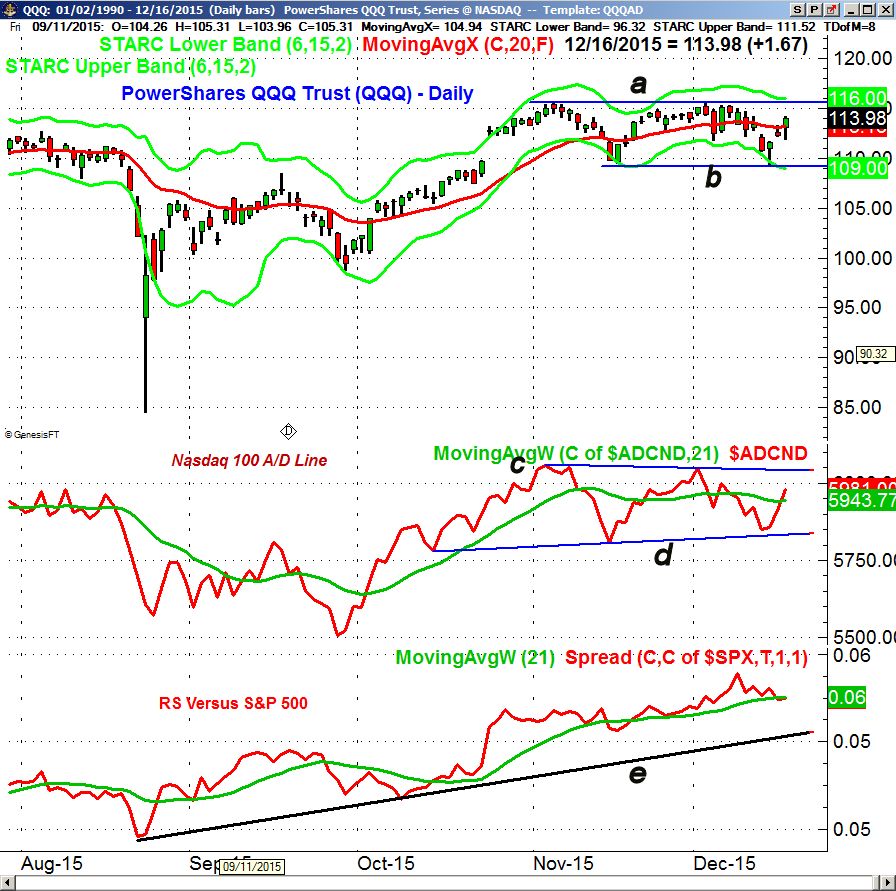
The PowerShares QQQ Trust (QQQ) is clearly acting the strongest of the market tracking ETFS as it just briefly violated the November lows, line b, on Monday. The QQQ is still locked in its six week trading range with resistance is at $115.75. A breakout above line a has upside targets in the $120-$123 area.
The Nasdaq 100 A/D line held above the November lows, line d, on the recent correction. The A/D line is back above its WMA with key resistance now at line c. A strong close above this level would be a bullish sign for the overall stock market.
The daily relative performance analysis has identified the QQQ as a market leader since September. The RS line made a new high a week ago. The RS line is on the verge of moving back above its WMA.
The monthly RS analysis, as I discuss in yesterday's You Tube video , identified QQQ has market leader since the bear market low in 2009.
There is initial support now in the $112.60-$113 area with Wednesday's low at $111.89
What to do? The recent sharp decline weakened but did not change the positive intermediate term outlook. The A/D lines need to again start leading the market higher as they did in October before a more aggressive buying strategy is warranted. I will have an update on the closing weekly data Saturday in my Week Ahead column.
Editor's note: If you like Tom's analysis and want specific entry/exit advice on ETFs check out Viper ETF Report his premium newsletter.
Comments
comments