

The powerful rally Tuesday caught many on Wall Street by surprise as the financial media was searching for a reason as to why stocks rallied. Their inability to find a plausible fundamental reason why stocks were strong had them concludes that "it must be technical".
The ability of the NYSE Advance/Decline line to move back above its WMA last Friday, as noted in last weekend's technical review, was a sign momentum had shifted. The A/D ratios were over 3-1 positive Tuesday and all of the A/D lines, even the lagging Nasdaq 100, have moved back above near term resistance.
The fact that the Spyder Trust (SPY) was able to overcome the May 2nd high at $208.18 is also a positive sign. However in my view the market needs to add to these gains in the next day or so in order to signal that the SPY can test if not exceed the recent highs at $210.92. The SPY would have to reverse to the downside and close back below $205 to reverse the positive momentum.
Much of the focus this week is on the retail sector as the April Retail Sales report is out on Friday. The March reading of -0.3% was disappointing but economists are looking for a sharp rise in auto sales to boost sales in April. The SPDR S&P Retail ETF (XRT) has been lagging the SPY this year as it is up 1.3% versus a 2.8% gain in the SPY.
The key question now is whether there are any signs that this retail ETF is on the verge of becoming a market leader and whether the technical studies on the SPDR S&P Retail ETF (XRT) or two leading department stores show any signs of bottoming.
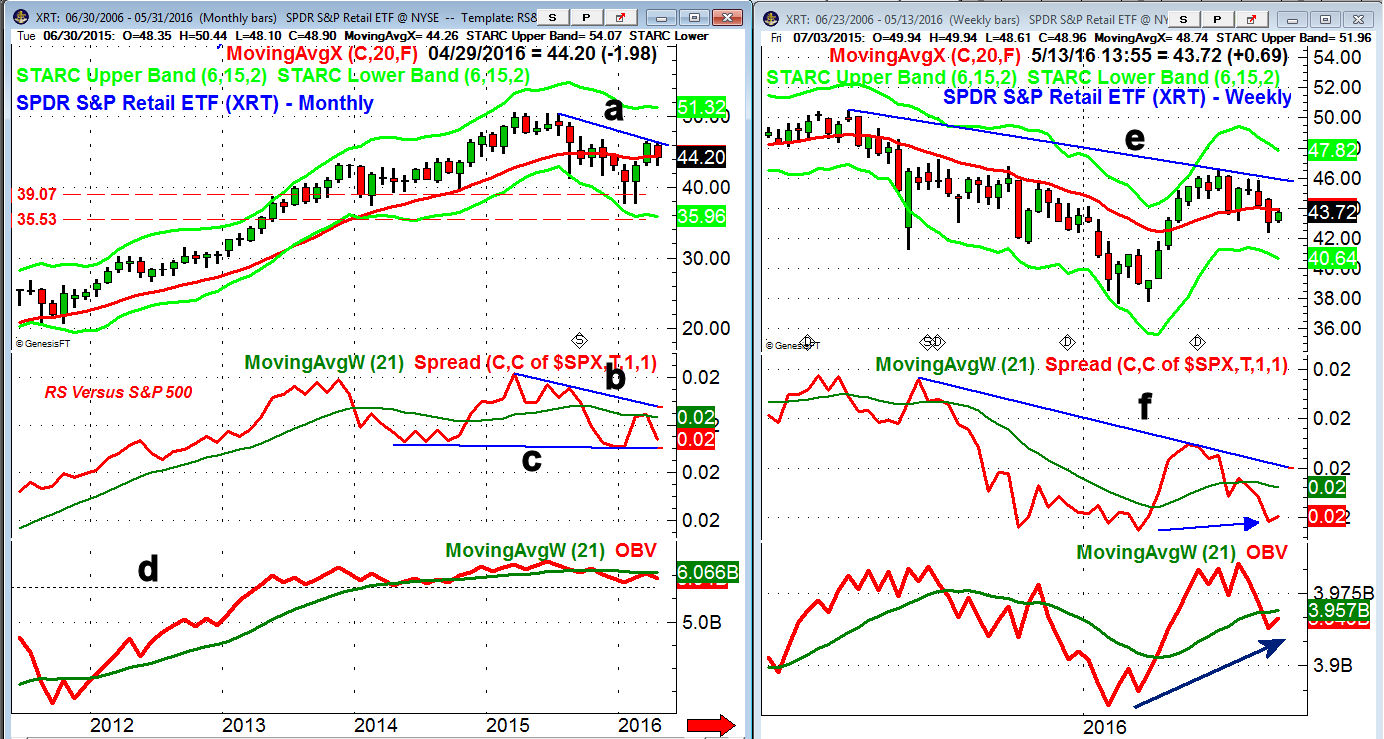
The monthly chart of the SPDR S&P Retail ETF (XRT) reveals that it dropped in early 2016 between the 38.2% and the 50% support levels from the 2011 lows. The relatively long monthly tails on the candle chart in January and February indicate there is good demand below $38.
- XRT closed down 4.3% in April as a higher close was needed to turn the monthly studies positive.
- A close above the February high at $46.50 would break the downtrend, line a.
- The monthly relative performance turned lower from its WMA in April and it needs to move through its downtrend in order to suggest that it is a market leader.
- The RS has important support at line c, and in 2016 it did form slightly lower lows.
- The monthly OBV has also turned down after failing to move above its WMA on the rebound from the lows early in the year.
- There is important long-term OBV support now at line d.
The weekly chart of the SPDR S&P Retail ETF (XRT) shows that it has been drifting lower since it peaked in early April at $46.50 (line e). The ETF has been trying to bounce this week and stay above the quarterly pivot support at $43.49.
- There is additional support at last week's low of $42.37 with the weekly starc- band at $40.64.
- On a move above the April highs there is stronger resistance in the $48-$50 area.
- The weekly RS line is trying to turn up from the early 2016 lows but is well below its WMA.
- A move in the RS line above the downtrend, line f, will indicate that XRT has become a market leader.
- The weekly OBV has been acting much stronger than prices as it is holding well above the early 2016 lows.
- A much stronger close in the next few weeks is needed to move the OBV back above its WMA.
- The daily studies are negative and it would take some time before they could bottom.
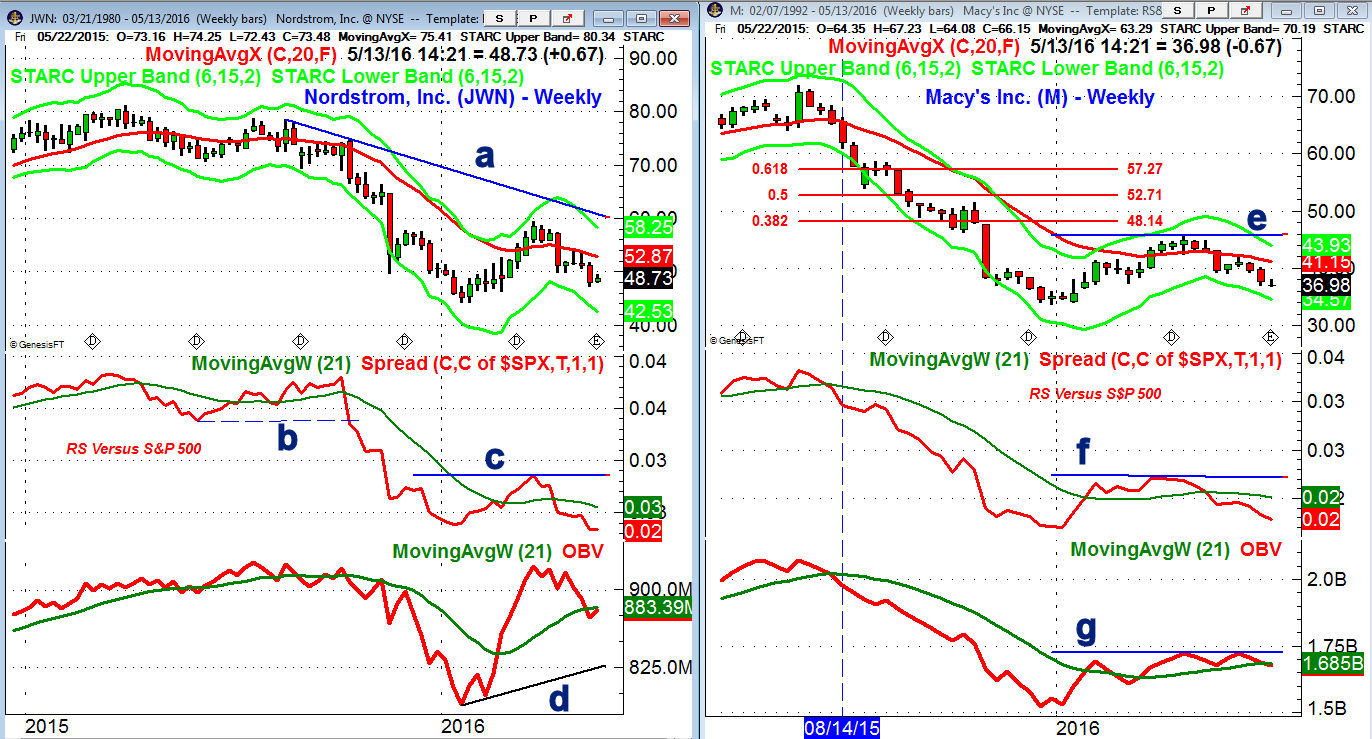
Nordstrom, Inc. (JWN) reports its earnings after the close Wednesday and it is down 1.1% YTD. The stock peaked at $59.37 in the middle of March. It is down over 17% from this high
- The 20 week EMA is at $52.88 with the weekly downtrend, line a, in the $60 area.
- There is next support at $46.37 with the monthly pivot support at $44.92.
- The weekly relative performance has dropped below the early 2016 lows.
- The drop in the relative performance below support, line b, last fall was a good sell signal.
- The on-balance-volume (OBV) is trying to run up but JWN would have to close sharply higher in order for it to move back above its WMA.
- The daily studies are negative and need at least a daily close above $53.82 before they could turn positive.
Macy's Inc. (M) reported a drop in sales of 7.4% and lowered their sales and earnings guidance for the year. The stock is down over 7% in early trading and is well below last week's low at $37.40. The late 2015 low and weekly starc- band are now being tested.
- The drop early Wednesday could erase all of the year's gains and the quarterly S2 pivot support is much lower at $29.93.
- Before its earnings both the weekly and daily studies were negative.
- The weekly RS line dropped below its WMA on April 1st signaling it was weaker than the S&P 500.
- The weekly OBV has been trading in a narrow range, line g, and has dropped back below its WMA.
- Volume this week is likely to be heavy so the OBV could see a sharp drop.
- There is initial resistance at $37 with the declining 20 day EMA at $39.03.
What to do? When buying a sector ETF or stock it is important that the weekly technical studies support your decision. Often times I will look to buy a retracement to good support when the weekly studies are positive but the daily indicators are negative. The risk management is a key part of this strategy but when the dominant weekly trend takes over a market can really move.
Heading into this week there was no technical reason to be long the SPDR S&P Retail ETF (XRT) or especially Nordstrom, Inc. (JWN) and Macy's Inc. (M) who were reporting earnings. The earnings from Macy's Inc. (M) highlight the potential risks and though Nordstrom, Inc. (JWN) could surprise the market there is still no reason to buy.
If you are interested in finding out how the weekly and daily can help generate unique stock trading ideas you might try the Viper Hot Stocks Report .
Comments
comments