

The memories of the Brexit vote had many investors and traders quite nervous as the markets closed before the French election. The S&P futures opened up over 20 points last Sunday night in reaction to the election results and powered to the upside in Monday's session.
Some in the financial media wondered whether Monday was just a flash in the pan or a Trump trap. On Tuesday morning I commented that " The sharp gains Monday caught many on Wall Street flat footed as the decline from the March high had lasted long enough to discourage many bulls. From a technical perspective the role of a correction is to reduce extremes in sentiment and to cause some to question their market outlook".
That individual investor sentiment has clearly changed as last Thursday's AAII survey the bullish % surged 12.3% to 38%. The bearish % dropped 7% to 31.7%. In last weekend's column "Bullish Evidence Building" I had pointed out that the bullish % had declined for the past eight weeks in a row.
Of course it is the technical indicators that tell us when it is time to act on the sentiment extremes and that is what I had focused on last weekend. The very strong market internals Monday further confirmed that the correction from the March highs was indeed over.
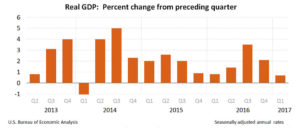

The investor's bullishness may be dampened by Friday's preliminary reading on 1st quarter GDP as the growth of 0.7% which was below the consensus estimate of 1.0%. Though the chart shows a downward trend for the past few quarters we will get a revision on May 26th. Many economists think the 1st quarter GDP is an aberration.
Since the new Trump tax plan is counting on GDP growth of 3% this data may concern some investors. Over the past two months, as stocks have declined, the financial press as come up with a number of reasons why investors should consider avoiding the stock market.
Just a few weeks ago many analysts voiced their opinion that 1st quarter earnings could not support the current stock prices and therefore stocks could not go higher. The strong earnings last week from Amazon (AMZN), Microsoft (MSFT) and Alphabet (GOOGL) is a sign that their earnings fears maybe misplaced.
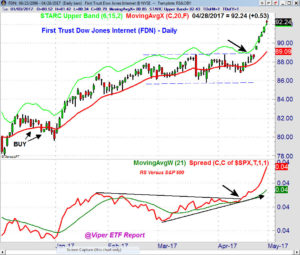

The strength of the big tech stocks pushed the First Trust Dow Internet ETF (FDN) up 2.9% last week. This ETF was recommended to Viper ETF clients on December 12th. The ETF has 9.7% in Alphabet and 8.5% in AMZN. The relative performance broke out again on April 18th, line c, confirming it was still a market leader.
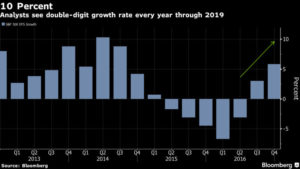

So far the earnings have been much stronger as 79% of the companies that have reported beat their earnings estimates. Many are looking for a 10% annual growth rate into 2019 which is very bullish for stocks. This long-term chart from Bloomberg shows the change in trend last year.
As Bloomberg reported " Since 1988, there have been 13 times when S&P 500’s annual earning growth topped 10 percent and in all but two instances, stocks ended the year higher. On average, the benchmark index rose 12 percent, data compiled by S&P Dow Jones Indices and Bloomberg show."
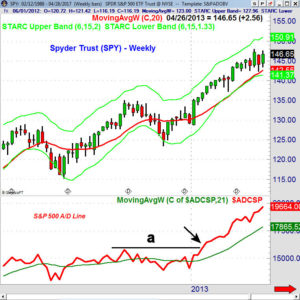

The 1st quarter earnings are on track to match the double-digit growth for the first time since 2013. The weekly chart of the Spyder Trust (SPY) through April 26, 2013 also includes the S&P 500 A/D line. There are some technical parallels to 2013 as in December 2012 the NYSE A/D line made new highs before the decline late in the month. At the time "Stuff Those Stockings with Stocks" I was very bullish on stocks for 2013.
The S&P 500 A/D line joined the NYSE by breaking through resistance at line a in early 2013. By the end of April the weekly A/D line was acting very strong as it was well above its WMA. The NYSE as well as the Nasdaq 100 A/D lines made new highs in December 2016 setting the stage for the market's rally so far in 2017.
The challenge for investors is to ignore the likely influx of articles that encourages them to sell in May. The historical evidence is clear that stocks do underperform from May to October as they average a 2% gain according to a study from Fidelity. This compares to a 5% gain from November through April.
As Zacks points out " As for first-term presidents, Democrats averaged a 6.1% gain in May through October, while Republicans had a loss of 4%". Of course the data masks the year-to-year variations. In 2013 the Spyder Trust (SPY) gained 10.6% from May to October even though there were short-term corrections in both August and early October.
The technical outlook in the Market Wrap section reveals that there are no signs yet that there is a significant top but one of course is possible before November. When intermediate term sell signals are generated then that will be the time to adjust your stock market holdings.
The Economy
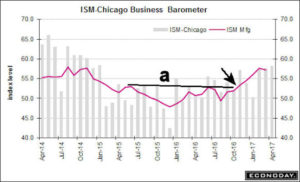

The manufacturing data out of Dallas and Richmond last week met or exceeded expectations, Chicago PMI or ISM -Chicago survey on Friday came in at a strong 58.3 as the consensus estimate was 56.5. The chart shows that this indicator of economic activity bottomed last fall when the resistance at line a, was overcome.
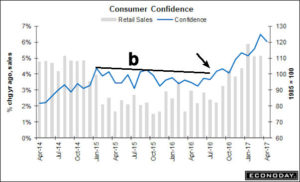
New Home Sales last week were very strong while the Pending Home Sales were a bit weaker than expected. The month ending data on the consumer was strong as Consumer Confidence was 120.3 a bit below the consensus of 123.1. The sharp improvement in the consumer's outlook was signaled last summer when the resistance at line b was overcome. Friday's Michigan Consumer Sentiment came in at 97 right in line with March's 96.9.
This week we have the PMI Manufacturing Index and ISM manufacturing Index on Monday along with Construction Spending. The FOMC meeting begins on Tuesday with the announcement on Wednesday afternoon. Also on Wednesday we have the ADP Employment report along with the ISM-Non Manufacturing and PMI Services Index.
On Thursday we get Factory Orders ahead of Friday's monthly jobs report.
Interest Rates & Commodities
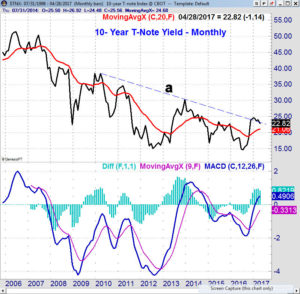

The yield on the 10 Year T-Note closed significantly lower in April at 2.282% compared to 2.396% at the end of March. The downtrend from the 2010 and 2013 highs was overcome last December but yields have declined since then. To suggest an important low in yields they need to turn higher in the next couple of months as the MACD-His did decline in April.
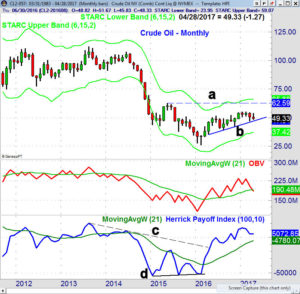
The crude oil futures lost $1.27 per barrel last month as prices failed to move above the previous month's high at $54.44. The close was still above the uptrend, line b, and the May close will be important as the OBV has now dropped below its WMA.
The Herrick Payoff Index (HPI) completed a bottom in early 2016, line d, as the downtrend (line c) was overcome. It is still above zero indicating positive money flow but the weekly HPI is negative.
Market Wrap
The Dow Industrials were up an impressive 1.9% last week with the S&P 500 and Russell 2000 up 1.5%. The Nasdaq Composite was up 2.3% and the Nasdaq 100 gained an impressive 2.8%. The advance/decline numbers were strong with 1901 stocks advancing and 1175 declining. Even more impressive was the 544 new weekly highs on the NYSE. The daily high/low analysis bottomed the week before the French election (see chart)
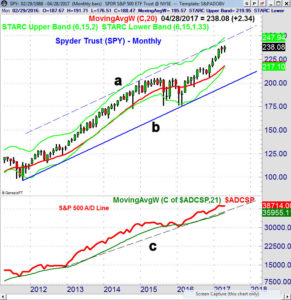

The Spyder Trust (SPY) was up just under 1% in April with quarterly pivot resistance now at $242.74. The monthly chart resistance, line a, and the starc+ band are in the $246-$248 area. The weekly A/D line closed above its WMA on Friday April 21st and rose even further last week. It is still below the early March high. The monthly A/D line is holding just below the February high.
The daily S&P 500 A/D line turned down on Friday but is well above its rising WMA. The rising 20-day EMA is at $236.01 with the daily starc- band at $235.55. The quarterly pivot is at $233.31.

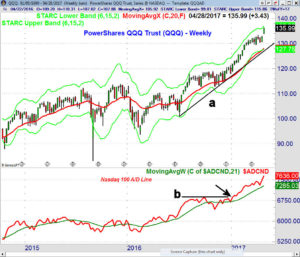
As has been the case since early in the year the PowerShares QQQ Trust (QQQ) continues to lead the stock market higher. Last week's close was not far below the weekly starc+ band at $136.89. The quarterly pivot resistance is at $141.85. The weekly Nasdaq 100 A/D line broke out early in the year as the resistance at line b was overcome. The A/D line turned sharply higher last week and has made convincing new highs.
The iShares Russell 2000 (IWM) broke out of its trading range early last week but the 1.3% decline Friday took it back into its range. The daily Russell A/D line made a new all time high last week confirming that the correction was over.
The SPDR Dow Jones Industrials (DIA) was up 1.8% last week and the weekly A/D line has moved back above its WMA but is still below the all time high.
What to do? The weekly and daily A/D lines are all above their WMAs and show no signs yet of a rally failure. Only the Nasdaq 100 and NYSE A/D lines have confirmed the new highs while the others have not yet. Even though new highs are likely in the next few weeks these divergences still bear close watching.
At this point it is unlikely that the major averages will complete significant tops before the third quarter. Those who are long since I recommended dollar coast averaging a year ago should consider taking some profits if when weekly sell signals are generated.
Those who are underinvested should still pay close attention to the risk on any new positions. Viper ETF subscribers added positions last week in the ETFs that had the strongest relative performance.
Subscribers are holding long positions in the QQQ and as well as other sector ETFs including XBI, XLY, XLK, VHT, IEFA, FDN and VBK. If you are interested in specific buy and sell advice in ETFs, you might consider a one-month investment.
For stock traders the Viper Hot Stocks Report recommends both long and short positions in high momentum stocks. Each service includes two reports each week and is just $34.95 each per month. Subscriptions can be cancelled on line at any time.
Comments
comments