

The new high in the Dow Transports last Friday generated some new bullish market calls. The rapid reversal over the past few days has caught many by surprise as it dropped over 2% in three days. The market’s reaction to Tuesday’s earnings from United Continental (UAL) has not helped.
They beat on earnings and revenues increased 6.4% year over year with total revenues of $10 billion. Five of the major airlines; American Airlines Group (AAL), Alaska Air Group (ALK) , Hawaiian Holdings (HA) JetBlue Airways (JLBU) and Southwest Airlines (LUV) all report earnings next week.
Should you be buying these airline stocks if they also dip in reaction to their earnings?
As I noted in an earlier article a Friday close above the quarterly pivot level (QPivot) signals a positive trend. Conversely a Friday close below the QPivot indicates a trend change to down. The QPivots are calculated from the previous quarter’s high, low and close.
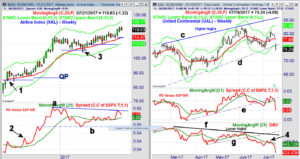

On the chart of the Airline Index (XAL) the QPivots are drawn in blue. XAL has been positive since July 15, 2016 when it closed above its QPivot, point 1. In March 2017, the 1st QPivot was violated during the week in mid-March (point 3) but XAL did not close below it on a weekly basis. The 3rd QPivot is now at $114.08 with the rising 20 week EMA at $114.49. These are now important levels of support.
The relative performance (RS) measures the performance of a stock or ETF to the S&P 500. For XAL it completed its bottom formation in the middle of September, point 2, this indicated the airlines were now market leaders. The RS stayed above its WMA until early February when the airlines consolidated.
By April 21st the RS flipped back to positive as XAL has edged higher for the past 14 weeks. The RS has not made a new high with prices as it has formed lower highs, line a. This may be an early warning sign. The RS is still well above its rising WMA and only a break below the support at line b, would confirm a significant top formation.
The sharp drop in United Continental (UAL) stock after beating on revenues and earnings was blamed on their lower outlook for 3rd quarter passenger revenue. There were warnings from the technical studies, as there were with Micron Technology (MU), before UAL reported earnings.
UAL peaked on June 2nd with a high of $83.04 and six days later it had dropped below its 20 day EMA and tested its starc- band. The first rebound was weak as it failed to move above its declining 20 day EMA and on June 27 the relative performance violated support at line e, as it was already below its WMA.
The $75 level was violated briefly in early July before a six day rally took UAL back above the monthly pivot resistance at $80.53 last week. The on-balance-volume (OBV) peaked in early March and while UAL was forming higher highs (line a) the OBV was forming lower highs, line f. The length of this bearish divergence sent a strong warning that volume was not supporting prices.
The OBV had broken support, line g, on June 12th which was another sign of weakness. On the rally last week the OBV was only able to move slightly above its declining WMA (point 4). Students of my OBV course know that rallies in the OBV back to the declining WMA are selling opportunities.
With UAL now trading below its daily starc- band it is in a high-risk sell zone and is likely to rally over the short term but there are no signs yet of a bottom.

What about the other airlines that report earnings next week?
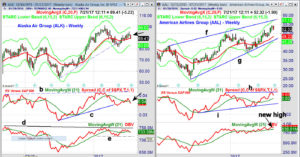
The weekly analysis of Alaska Air Group (ALK) suggests it will be vulnerable when it releases earnings on July 26th. The weekly chart shows that if it closes Friday below $91.52 which seems quite likely it will trigger a weekly doji sell signal (point 1) Of course a weekly close below the QPivot at $88.32 would be even more negative. The May low was at $81.79.
The relative performance made a new high with prices in early March (line b) and two weeks later dropped below its WMA. It was a sign of weakness that the key support for the RS, line c, was broken at the end of April. This signaled that ALK was not longer a market leader.
The recent rebound in the RS appears to be over as it is likely to drop below its declining WMA this week. The weekly OBV did diverge from prices as it peaked in 2015 and then formed a lower high in 2016, line d. The OBV will likely drop below its WMA this week and a violation of key support at line e, will be consistent with a more significant top.
American Airlines Group (AAL) has the best looking chart of all the airlines as it made a new all-time high just last week. The upper chart resistance, line f, and the weekly starc+ band are in the $57 area. It is well above the rising 20 week EMA at $48.22 with further support at $47, line g.
The weekly RS did make a marginal new high a week ago and looks ready to turn lower this week. It is well above its rising WMA. It would take a drop below the support at line i, to indicate AAL has really topped out.
The weekly OBV made a new high last week and it is still in an uptrend and above its WMA. The daily studies, unlike those on ALK are positive and suggest that the recent pullback is just a pause in the uptrend. The monthly pivot is at $50.09 with monthly pivot support at $48.23.
Hawaiian Holdings (HA) appears to have completed a double top in the $60 area and a weekly close below $45 will confirm this top formation. The weekly RS and OBV are negative but there are some signs of a short term bottom basis the daily studies.
JetBlue Airways Corp. (JBLU) is in a solid weekly uptrend from the February lows as it made a new high last week at $24.13. It is well above the rising 20 week EMA which should provide good support. The weekly relative performance and OBV are both positive. The daily indicators are also in clear uptrends.
Southwest Airlines Company (LUV) will trigger a weekly doji sell signal if it closes below $61.23 on Friday. The 20 day EMA is now at $58.40 with additional support in the $55 area. The weekly studies have turned down but have not formed any divergence. Therefore they do not indicate that an intermediate term top is in place. The daily indicators are negative and do allow for a deeper correction.
The two airline stocks that look the most positive based on the weekly and daily technical studies are American Airlines Group (AAL) and JetBlue Airways Corp. (JBLU). The recent breakout in the small cap iShares Russell 2000 (IWM) should be a positive for JBLU. With the entire group currently under pressure if these two airlines do reach stronger support at their rising 20 week EMAs I would wait for prices to stabilize before looking to buy. Be sure to manage the risk. I will be positing more charts on Twitter.
The weekly as well as the daily relative performance and on-balance volume analysis play a key role in the ETF or stock selection for my premium services. Subscribers to the Viper ETF Report and the Viper Hot Stocks Report receive two reports each week with specific buy and sell advice. Each service is just $34.95 per month.
For those who want to learn more about my trading strategies you can download a copy of my eBook. This will add you to the email list for the free Viper Reports. I send out market commentary and technical tips several time a week. Additional market comments are often posted on the Viper Report Facebook page.
Comments
comments