The stock market managed to shake off the threat of a government shutdown on Friday to close the week higher again as the NYSE A/D ratios were strong at 2-1 positive. Apparently some on Wall Street did not think a shutdown was possible or were not worried about its impact.

The stock market mood could change next week since the funding deadline passed on Friday night. Of course between now and Monday’s open an agreement could be reached. Every minor dip since the start of the New Year has been met with buying as last Tuesday’s downside reversal and lower close was followed by a 323 point Dow gain on Wednesday.


So what happened to the stock market during the government shutdown in 2013? The battle between the House and Senate leading up to the shutdown lasted from September 20th until October 1st when the funding ran out. The stock market peaked two days before the House bill to defund health care was passed on September 20th.
The back and forth between the House and Senate continued until September 27th when the Senate passed a bill removing the health care measures. This was also the day that the S&P 500 A/D line moved below its WMA. This was rejected by the House and the funding ran out on October 1st.
The Spyder Trust (SPY) bottomed out seven days later and by the time the funding was restored on October 17th the SPY was well above the lows and the closing price on October 1st. From the SPY high on September 19th to the October 9th low the SPY lost 5.2%. By the end of 2013 the Spyder Trust had gained 12.8% from the October 9th low and recorded the bull market’s best year.
Some will remember that this occurred less than a year after the US Government went over the “fiscal cliff” at 12:01 AM on January 1, 2013. Two hours later the Senate passed a compromise bill that the House finally accepted that evening.
The stock market decline on worries over the fiscal cliff was a great buying opportunity as the A/D line had generated a bullish signal in December and I thought stocks could be the “best Christmas gift”.
So is a similar correction possible now and what might it mean to the economy?
The stock market is much stronger now technically than it was in 2013 but is also much more overbought. In September 2013 the S&P 500 A/D line was just able to move slightly above the August high.

The weekly S&P 500 A/D line broke out on November 21st (line 1) and has made a series of significant new highs since then with another new high last week. In 2013 the pre-shut down peak in the SPY fell well short of the weekly starc+ band but the SPY has closed above its weekly starc+ band for five of the last six weeks.
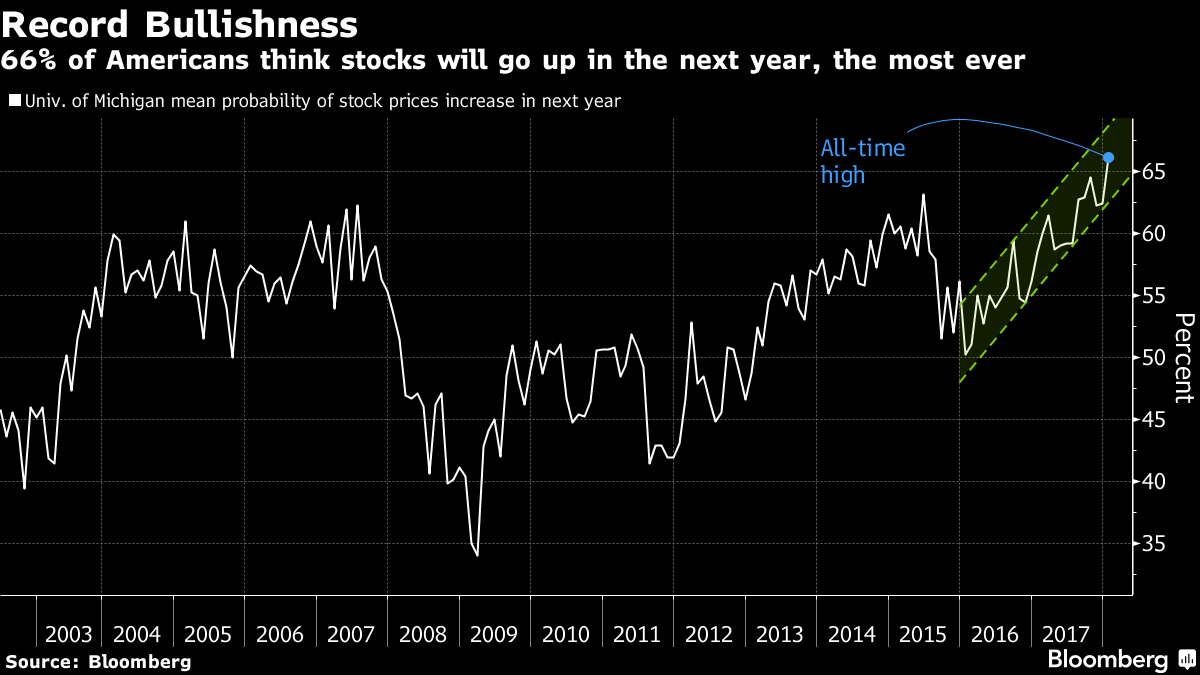
Consumers were much less confident about the stock market and the economy in 2013 as Consumer Sentiment was at 80 before the 2013 shut down but was 94.4 on Friday. A recent University of Michigan survey revealed that 66% think the stock market will be higher in the next year but in 2013 only about 55% felt that way.


Those who have been following my column over the years know that the NYSE A/D line made a new high at the end of March 2016, as the resistance at line a, was overcome. Though it pulled back in October 2016 just before the election it held well above its rising WMA and has since continued to make a series of new highs. Prior to the last bear market it diverged from prices for several months before stocks topped out.
Therefore even though the bullish sentiment is quite high there are no warnings of either a major or intermediate term top from the A/D line analysis. If the shutdown lasts there will be economic consequences but I do not think it will be enough the change the positive trend that has been in effect since 2016. I also think that the economic data will help encourage the recent buyers to stay with their stock positions.

Since the November 21st upside breakout in the daily S&P 500 A/D line the majority of the stock market averages and sectors have been in a relentless uptrend. The A/D line has made a series of higher highs since the resistance at line a, was overcome. In fact the S&P 500 A/D line made another new high on Friday and continues to act strong.
Before the S&P 500 A/D line could move into the corrective mode it would take several days of quite negative A/D numbers. The correction in 2013 just lasted three weeks and the weekly A/D line never dropped below its rising WMA.


Since the A/D lines broke out in November the Spyder Trust (SPY) and most of the key sectors moved higher gaining 3-4% until just before Christmas when the Energy Sector Select (XLE) surged to the upside, point 1. By the end of the year is was up over 7% from the November 21st close.
By last week the outperformance of the energy sector was even more pronounced as it is leading the SPY by 5% over the past eight weeks. It has also done much better that the 9.4% gain in the red hot Health Care Sector Select (XLV).
In last September’s column Follow The Money Flow For Crude Oil I explained that my favorite indicator for the futures market, the Herrick Payoff Index (HPI), was indicating positive money flow for crude oil. This was contrary to the view of many on Wall Street as some were looking for crude oil to drop below $40.


The weekly chart of March Crude Oil shows that downtrend (line a) in the HPI was broken in late July and the strength of the rally in August indicated that a bottom was forming. When the daily HPI turned positive on September 1st it was consistent with the weekly readings.
The weekly HPI made a marginal new high a week ago and is still well above its rising WMA. The daily HPI did drop below its WMA last week. Over the past few weeks the hedge funds and other large speculators have established their largest long position in many years as the chart. This is plotted in green on the bottom of the chart.
They added another 10% on the long side as of last Tuesday. This combined with the weakness in the daily HPI readings increases the odds of a pullback in crude oil over the next few weeks.
Viper ETF traders had gone long the SPDR S&P Oil and Gas Exploration (XOP) in early September. The strong price action in September confirmed a bottom based on my weekly relative performance (RS) analysis so the Vanguard Energy ETF (VDE) was recommended to investors on a pullback.
It was preferred over the Energy Sector Select (XLE) as it has 142 holdings versus only 32 for XLE. Investors were able to buy on the pullback towards the quarterly pivot at $90.60 in October. This is a good example of the different strategies I follow for traders and investors as I discussed last week.
Traders bought based on the positive daily signals in early September while investors waited until the weekly indicators had also bottomed out before buying in October. The volume declined as prices corrected during the October pullback but volume has risen sharply this year.

There has also been a tremendous interest in the overseas markets in 2018 as since November 21st the Vper ETF holdings in the WisdomTree Japan (DXJ), iShares Europe (IEV) and the iShares Core MSCI EAFE (IEFA) are all up over 7%.


Investors have been long the iShares Core MSCI EAFE (IEFA) since early March. As I pointed out in my October 14th Forbes article “It has 63% in greater Europe and 36% in Asia with a yield of 2.43% and an expense ratio of 0.08%”.
The weekly on-balance-volume (OBV) surged early in the year and the fact that the 2nd QPIVOT at $56.66 held in April was a positive sign. The OBV stayed strong until it briefly diverged from prices, line a, in November so traders took profits. Unfortunately traders did not get back in IEFA but did buy IEV before it broke out of its trading range.


On January 5th my Viper Report Facebook post “Getting on the Global ETF Bandwagon” I highlighted the new weekly buy signals on many of the global ETFs that I follow on a continuing basis. These tables are sent out every other week. Currently there are a number of global ETFs that I am watching for a good entry point.
Many of the global ETFs have had some very a high volume days already this year which I feel is bullish for the intermediate term. For example just over a week ago 16 million shares traded in IEFA which has an average volume of just 4.4 million shares. Last week there were two days where 3.7 million and 2.3 million shares were traded in iShares Europe (IEV) which has an average volume of just 673K.
Surprisingly very few of the high profile analysts ever comment on volume in their analysis which I feel is a mistake. The OBV is my favorite volume indicator and it is available on most free platforms. Changes in the weekly OBV analysis generally signal significant changes in the trend for both ETFs and stocks. I also do daily monitoring to spot surges in volume.
As stocks open on Monday I will watching the A/D numbers and the volume closely if the shutdown has not yet been resolved. It of course is possible that there will not be much of a reaction as the stock market has become quite adept at ignoring events that it reacted to in the past.
If the A/D numbers are very negative Monday morning and the volume in some of the key ETFs is high then we could see a decline of 3%- 5%. A correction of 5% would take the SPY to the $266 area which is still above the quarterly pivot at $262.25.
Investors should not let such a correction change their strategy but if your equity exposure is now too high because of the strong market raising a bit of cash is probably a good idea. For Viper Hot Stock positions I will be tightening my stops and taking more profits.
If there is a meaningful correction it should setup a good buying opportunity especially in some of the global ETFs. I will be updating my analysis this week on Twitter.
Both the Viper ETF and Viper Hot Stocks report are sent our twice a week. They include in-depth market commentary and specific recommendations. Each report is only $34.95 per month.
Comments
comments