

The stock market put in an impressive performance last week after suffering its worst week since last September. Stocks were set up for a sharp drop on Monday as the S&P futures closed Friday March 23rd at 2342.75 and traded as low as 2317.75 as the futures opened in Europe. The lows were tested again in early trading and stocks then spent the rest of the day rebounding.
The daily chart of the futures shows that they closed Monday well above the day's lows. The turnaround in the market internals was even more constructive. The A/D ratio went from over 2-1 negative in early trading Monday but then ended the day slightly positive.
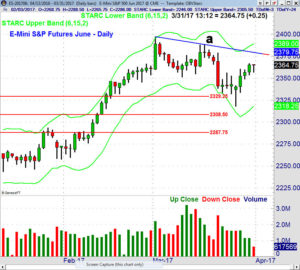

The low in the S&P futures was right between the 38.2% support at 2329.25 and the 50% support at 2308.50. Volume has declined over the past two weeks and a high volume close above the resistance at line a, will project a move to the 2417 area.
Even though stocks closed the week higher the failure of the health care bill has apparently kept some individual investors more cautious. According to AAII the bullish % of individual investors dropped 5.1% last week to 30.2% while the bearish % rose 6.9% to 37.4%.
Another wave of selling or more signs of incompetence from the new government could still push the bullish % even lower. Many of the key government agencies are still operating with a skeleton staff. It was not encouraging that that the only appointee so far to the White House science and technology has a political science degree.
The recently beaten down sectors like energy and financials made new lows early Monday and then reversed to the upside. Though sustainable bottoms have not yet been confirmed by the technical studies sector rotation could help to drive stocks even higher.
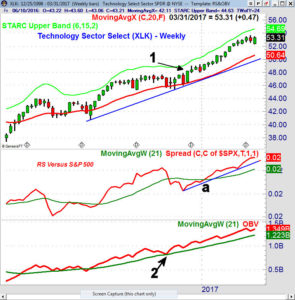

There are no signs yet that the market leading technology sector is ready to top out though their outperformance has been getting quite a bit of press lately that could trigger some profit taking. The Technology Sector Select (XLK) has been a favorite since December when it closed at new all time highs (point 1).
The price action was confirmed by the daily relative performance (RS) and OBV analysis. The weekly RS was rising and it also soon turned positive. The weekly OBV had been leading prices higher since the middle of 2016 when it tested its rising WMA.
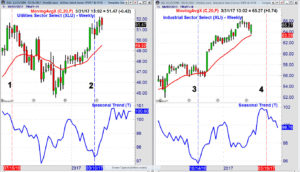

Two sectors that have strong seasonal trends in April and May are the Utilities Sector Select (XLU) and the Industrials Sector Select (XLI). The XLU typically bottoms in early March (line 2) but the weekly technical studies turned positive in the latter part of January as the weekly relative performance completed its bottom formation. The seasonal analysis indicates that XLU typically tops out in the middle of July, point 1.
The Industrials Sector Select (XLI) typically bottoms in October (line 3) and XLI actually bottomed a few weeks later in 2016. The pullback early last week took XLI back to the 20 week EMA where the buyers stepped in as it looks ready to close the week up over 1%. It is still 2.4% below the early March high. There are 68 holdings in XLI, it has an expense ratio of 0.14 and a yield of 1.95%. The Vanguard Industrial ETF (VIS) has 347 holdings with a lower expense ratio and a yield of 1.73%.
Investors who have not been invested for most of the past five months should continue to be selective buyers. In last week's Is The Stock Market Now On Thin Ice? I pointed out that the stock market was not without problems. The 19% drop in Lululemon Athletica (LULU) last week was a stark reminder of why you need to be a very careful buyer.
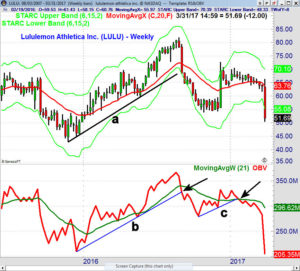

This chart is from a trading lesson that will be sent out to all existing and new Viper clients next week. In September 2016 the support in LULU was broken, line a. This was confirmed by a drop in the OBV through support. The rebound in late 2016 just took prices back to strong resistance in the $70 area.
As LULU started to weaken in late January the OBV dropped below the short-term support at line c. This suggested the rebound might be over. For the next eight weeks LULU drifted as the OBV formed lower lows. The OBV was in a well-defined downtrend for six weeks prior before week's plunge.
Over the past few weeks it has been the divergence between the small cap Russell 2000 and the Spyder Trust (SPY) that had me concerned. The 2.4% rebound in the IWM last week has removed most of the market risk.
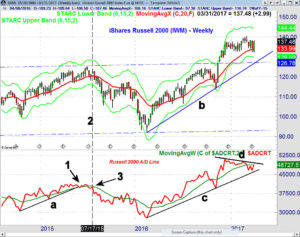

It was the action of the weekly Russell 2000 A/D line that had me concerned last week. It dropped below its WMA three weeks ago and subsequently the WMA had started to flatten out. A similar pattern developed in the summer of 2015 so I was aware that a sharp drop last week with negative breadth would have been bearish for stocks.
In May of 2015 the weekly A/D dropped below support at line a, and its WMA (point 1). The OBV moved sideways to lower and in the middle of July (line 2) the A/D line rebounded lack to its flat WMA. The next week IWM dropped sharply as did its A/D line which warned of the imminent sharp decline.
The weekly Russell 2000 A/D line has now moved back above its WMA as has the daily A/D line (not shown). The daily A/D line now needs to move above the resistance from December and February to confirm that the correction is over.
The Economy
It was another good week for the economic data as the Dallas Fed Manufacturing Survey came in at 18.6 up from 16.7 last month. Housing prices were up according to the S&P Corelogic Case-Shiller HPI which gained 0.9%.
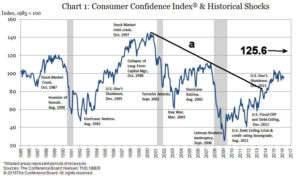

The Conference Board's Consumer Confidence came in at a very strong 125.6 which was the highest reading since 2000. The long-term downtrend from the 2000 high, was broken in early 2014. The Pending Home Sales Index was up 5.5% on Wednesday and Thursday's GDP at 2.1% was a bit better than expected.


There was some good news on inflation from the Commerce Department as it moved above 2% for the first time in the past five years. This is based on the personal-consumption expenditures price index which is the preferred inflation gauge that the Fed follows. The downtrend, line a, has been convincingly broken. One should remember that gradually increasing inflation is a good sign for the economy and for stocks.
Friday's Chicago PMI was just a bit better than expected while Consumer Sentiment at 96.9 was a bit lower than the expected 97.6.
This week we have the PMI Manufacturing Index and ISM Manufacturing Index on Monday along with Construction Spending. Factory Orders are out on Tuesday with the ADP Employment report, PMI Services Index, ISM Non-Manufacturing Index and the FOMC minutes on Wednesday. The monthly jobs report is out on Friday.
Interest Rates & Commodities
The yield on the 10 Year T-Note was down slightly after dropping sharply the past two weeks. The 20-week EMA at 2.351% has been tested with the 2017 lows at 2.309%. The weekly momentum based on the MACD is still negative and declining. There are no signs yet from the daily technical studies that the decline in yields is over.
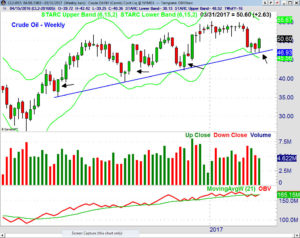

Crude oil reversed to the upside last week as it was up 5.6% after dropping down to the prior weeks low. As the chart indicates (see arrows) there have been a number of upside weekly reversals since 2016 that have led to sustainable rallies. The weekly OBV has moved slightly above its WMA while the HPI (not shown) is still below its WMA. The close was just below the April pivot at $50.60 with further resistance in the $52 area.
Gold was higher early in the week but then closed a bit lower as the gold futures formed a doji. This sign of indecision does allow for a pullback this week.
Market Wrap
Though stocks were mixed Friday it was a good week and a great quarter for the stock market. For the week the beaten down Dow Transportation Average was up 2.1% and the Russell 2000 was even better gaining 2.31%. Both were much better than the respective 0.80% and 0.32% gains in the S&P 500 and Dow Industrials. The weekly A/D numbers were strong as 2292 stocks were higher and just 809 lower.

The Nasdaq 100 made a new high again last week up 1.33% and was by far the strongest for the quarter as it was up 12%. This outperformance was consistent with the bullish signals from the A/D line as i pointed out in my January 14th comments " There were signs in December that the tech sector was going to start leading the market higher. For Viper ETF clients long positions in the QQQ and the Technology Sector (XLK) were recommended in December."
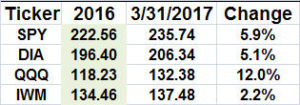
It was the best quarter for the Spyder Trust since 2015 as it was up 5.9% and the SPDR Dow Industrials (DIA) was not far behind. The iShares Russell 2000 lagged as it was up just 2.2%.
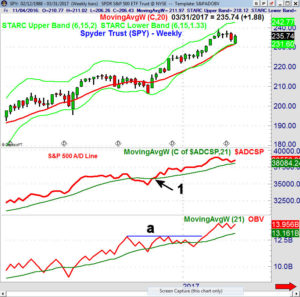

The weekly chart of the Spyder Trust (SPY) shows that the low at $231.61 just reached the 20-week EMA. The April pivot resistance is at $239.48 with the weekly starc- band at $242.77. The weekly A/D line has turned up from its WMA and a higher close this week will provide further evidence that the correction is over. The weekly on-balance-volume (OBV) broke through resistance , line a, in early February and still looks strong.
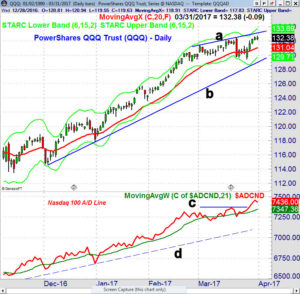

Only the Nasdaq 100 A/D line has confirmed that the correction is over as it broke through its resistance, line c, last week and made another new high. It is well above its WMA which has started to turn higher but still could be tested on a pullback. Both the weekly and monthly A/D lines made new highs last week.
The QQQ has almost reached the chart resistance in the $133 area, line a. The new monthly pivot resistance is at $133.69 with the weekly starc+ band at $135.63. The rising 20-day EMA is now at $131.04 with the daily starc- band at $129.71. The new quarterly pivot is at $127.42.
What to do? The fact that the downside reversal I discussed last weekend was followed by a strong close reduces the chances that we will see a deeper correction before the market turns higher. The stocks market's ability to reverse after Monday's selling and close higher was a sign of strength.
On a short-term basis the market could pullback early this week and drop back towards last week's low. The weight of the evidence now suggests that the worst of the selling is likely over. Only a sharp break in the IWM and the Russell 2000 A/D lines back below last week's lows could change this view.
In April 2016 I suggested that "those who were not invested should consider a dollar cost averaging program where six equal investments were made over a period of time. Those non-active investors should consider a broadly diversified ETF like the Vanguard Total Stock Market ETF (VIT) or the Vanguard MSCI Europe (VGK). Though another major push to the upside could set the stage for a deeper correction those currently under invested could do some more light buying on weakness.
For more active investors and traders who have been participating in the market's rally I will have some new recommendations for Viper ETF clients in Monday's report.
Both the 4-5 page ETF and Viper Hot Stock Reports are sent out twice a week and each report is only $34.95 each per month. New subscribers also receive regular and past Trading Lessons. The subscriptions can be cancelled on line at any time.
Also, check out our Five+Ways+To+Improve+Your+Trading.
Comments
comments