

The strong 3-1 positive A/D numbers have confirmed the bullish short term formations discussed in yesterday's Tweet. The NYSE A/D line is now in a short term uptrend and the McClellan Oscillator has broken the downtrend from the October highs.
The SPY, QQQ, DIA and IWM formed triggered high close doji buy signals with Tuesday's close above Monday's doji highs. This is bullish and it would now take a drop below Monday's lows to reverse these short term positive signals. Futures are showing nice gains 90 minutes before the open with the Euro zone markets also up sharply.
The S&P 500 A/D line has moved back above its WMA suggesting the Spyder Trust (SPY )could rally back to last week's high of $207.25. A close above this levels could set the stage for a test of the $209-$210 area.
As long term readers know I run a series of exhaustive scans each weekend and three stocks could give positive weekly signals if they close above their key levels on Thursday.
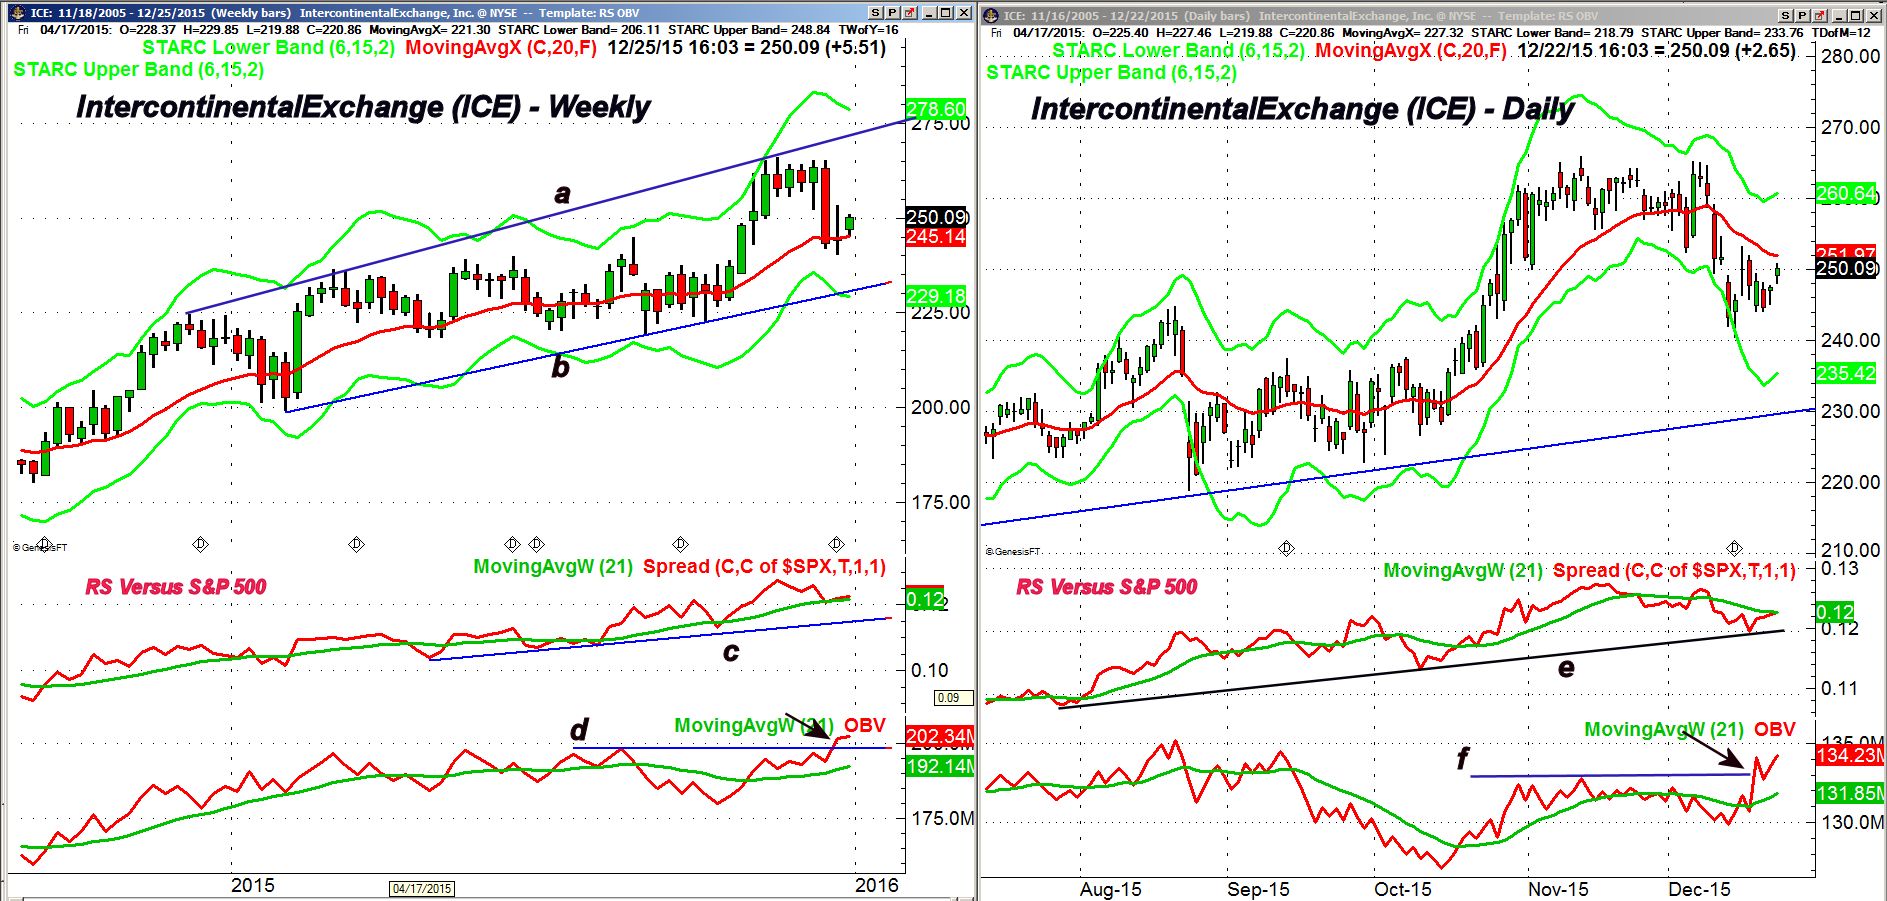
IntercontinentalExchange (ICE) dropped in the past two weeks to test the 20 week EMA at $245.14. It formed a doji last week with a high of $253.19. Dojis are consistent with market indecision and a close above the doji high will indicate that the weekly uptrend has resumed.
The monthly pivot resistance stands at $259.29 with the daily starc+ band at $260.67.
- The weekly trend line resistance, line a, is in the $275 area with the weekly starc+ band at $278.60.
- The weekly relative performance is still in its long term uptrend, line c.
- The RS line is now trying to turn up from its WMA.
- The weekly OBV has been acting stronger than prices as it has surged to new highs.
The daily chart shows that Monday's close was just below the 20 day EMA at $251.97.
- There is short term support now at $244 with stronger at last week's low of $240.37.
- The daily RS line is now testing its WMA but is still well below the December high.
- The daily OBV completed its bottom formation last week and made a new rally high on Tuesday.
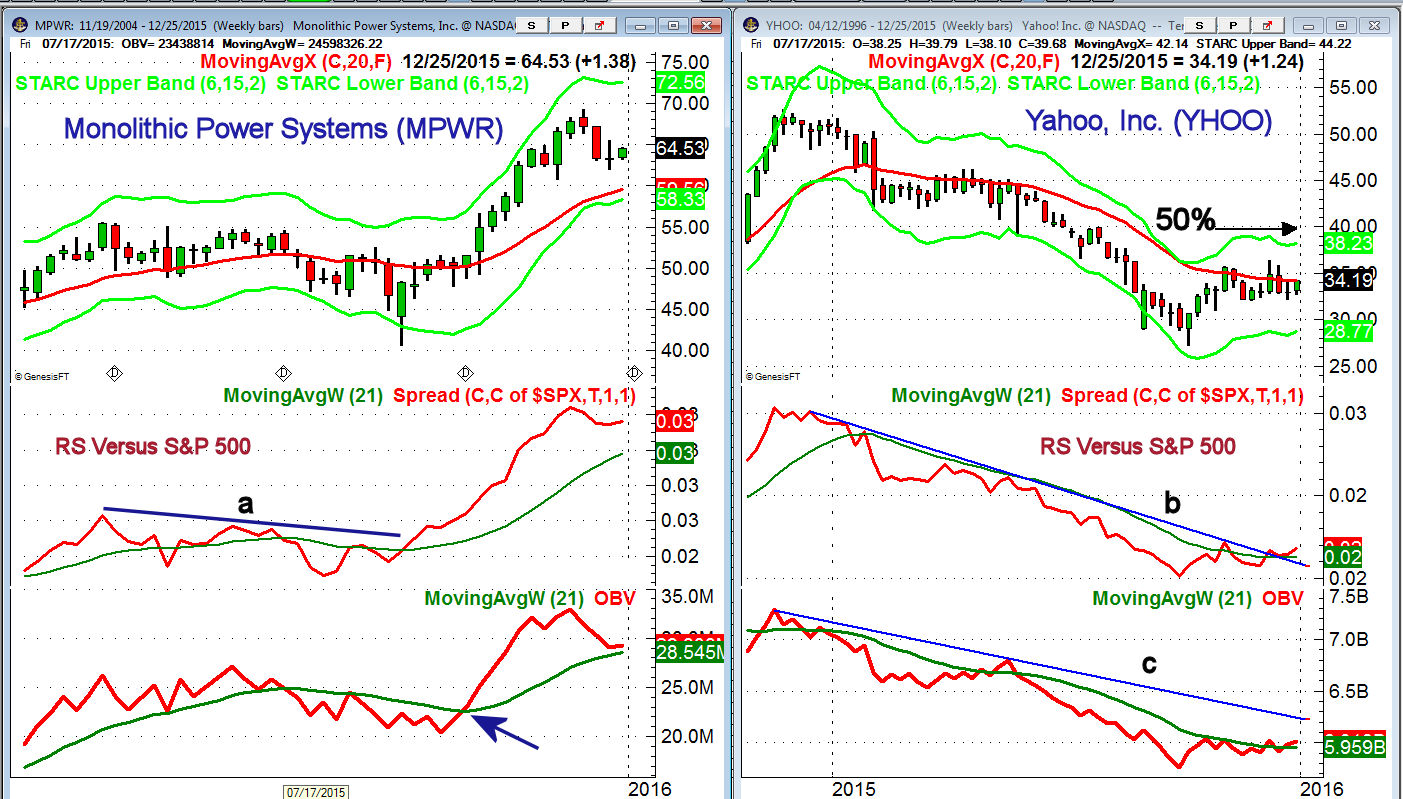
Monolithic Power Systems (MPWR) is a $2.6 billion dollar company provider of small energy efficient solutions for a wide range of markets.
- The weekly chart shows that a doji was formed last week and a weekly close above $65.46 would be positive.
- The weekly starc+ band stands at $72.56 which is over 10% above current levels.
- There is weekly support at last week's low of $62.05 with the 20 week EMA at $59.56.
- The weekly relative performance broke through resistance, line a, on Sept. 4th several weeks ahead of prices.
- The weekly OBV surged above its WMA on October 2nd as the overall market staged an important upside reversal.
- The OBV has dropped back to its WMA and may turn higher this week.
- The daily RS line is back above its WMA but the OBV is not.
Yahoo, Inc. (YHOO) has been under fire since its recent earnings and the ever changing corporate plans. There does not seem to be much in the way of positive sentiment for the stock so a strong rally would be a surprise.
- YHOO closed Tuesday above last week's doji high of $34.07 with further resistance from three weeks ago at $36.39.
- The weekly starc+ band is at $38.23 with the 50% retracement resistance from the November 2014 high at $39.67.
- There is even stronger resistance in the $42-$45 area.
- The weekly relative performance broke its downtrend, line b, three weeks ago.
- A move in the RS line above the October high will confirm it is a market leader .
See my You Tube Video - RS Analysis Part 2 for more examples of RS bottom formations.
- The weekly OBV is not nearly as strong as it is just above its WMA.
- The OBV has important resistance at the downtrend, line c.
- There is weekly support at last week's low of $32.21
What to do? These three stocks, given the positive short term action in the overall market could provide some surprises as we head into the end of the year. Therefore watch to see if they close the week above last week's doji highs.
Editor's Note: If you are interested Tom's weekly scans of Nasdaq 100 & IBD top 50 stocks along with specific advice you might try the Viper Hot Stocks Report, just $34.99 a month. You can cancel anytime on-line.
Comments
comments