

With just two more days of stock market trading left in May the S&P 500 is up almost 1.4%. It is possible these gains could be erased in the last two days of trading but the market leading PowerShares QQQ Trust (QQQ) that tracks the Nasdaq 100 is up 3.6% so far in May.
NEW YORK, NY - MAY 26: The U.S. Coast Guard Silent Drill Team walks by One World Trade Center as they perform at a military re-enlistment and promotion ceremony for the U.S. Navy and Coast Guard outside of the 9-11 Memorial on May 26, 2017 in New York City.
In 2017 QQQ is up 19.4% versus just 8.6% for the Spyder Trust (SPY) and 2.2% for the small cap iShares Russell 2000 (IWM). So far the five month performance of the QQQ beats the yearly performance of the past two years when there were single digit gains. However in 2013 the QQQ was up 36.6% and 19% in 2014.
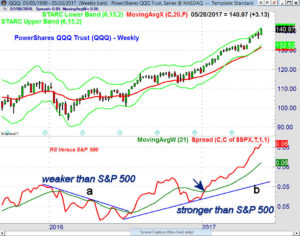

The strong gains this year in the QQQ were not surprising based on the bullish relative performance (RS) and A/D analysis at the start of the year. The RS is calculated by taking the ratio of an ETF or stock to the S&P 500. When it is rising then the ETF or stock is outperforming the S&P 500.
The RS analysis for QQQ was in a downtrend (line a) from the start of 2016 until the end of July when it moved back above its WMA. It stayed above it until early November but maintained the pattern of higher highs and higher lows (line b) until the rally resumed.
By the first week of 2017 the RS had moved above its WMA and it has continued to make new highs consistent with a market leader. Viper ETF investors are still holding long positions in QQQ from early December.
Very few analysts, myself included, thought that the small cap iShares Russell 2000 (IWM) would underperform the S&P 500 through May. Looking at the long term charts of the S&P 500 and IWM one can make some interesting observations.
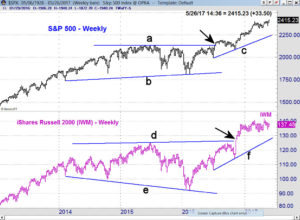

The S&P 500 had been in a broad trading range from 2014 through July 2016 when it overcame resistance at line a. The S&P 500 pulled back into the breakout level just before the election before turning sharply higher. The width of the trading range (lines a and b) has initial upside targets in the 2450-2500 area.
The iShares Russell 2000 (IWM) shows a less regular formation as it formed lower lows, line e, in 2014 and 2016. The key resistance at $125.33 (line d) was overcome the week of the election. This gave minor upside targets at $150 with further in the $160 area. Aside from the April high at $141.84 the IWM has stayed in a range from $132-$140.
The weekly S&P 500 and Nasdaq 100 A/D lines have continued to make new highs in 2017 which has kept the intermediate trend bullish. As I point out in the market wrap section the Russell A/D line moved back above its WMA this week. For the Viper ETF Report I have favored the less diverse Vanguard Small-Cap Growth Index (VBK) which is up 8.6% YTD.
In the April 29th column “Should You Listen To Sell In May?” I suggested that investors should not listen to those who were advising them to sell in May.The next week the improvement in the charts pointed to higher stock prices in May.
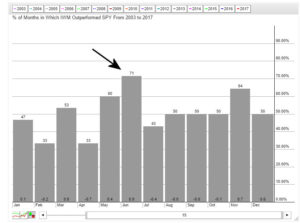

So what about June? The S&P 500 has a slight upward seasonal bias in June as it has often peaked in the middle of the month. This chart from stockcharts.com shows that since 2003 the IWM has outperformed the SPY 71% of the time in June. This makes it the best month for the IWM versus the SPY over the past fifteen years. This is interesting especially since reports indicate that $3.5 billion left IWM in late May.
The recent upside breakouts in all of the A/D lines other than the small cap Russell 2000 paint a bullish outlook for the stock market in June. They would typically take 3-5 weeks before they could complete top formations. The weekly A/D lines need to form divergences before an intermediate term top is on the horizon.
The sky high technology sector will be the most vulnerable to profit taking as we head into the summer months. Viper Traders took excellent profits in XLK and FDN prior to the recent sharp drop and scaling out of longs on strength is never a bad idea.
The Economy
The GDP on Friday came in better than expected at 1.2% as the market was looking for 0.8%. The final reading comes on June 29th with the advance reading for 2nd quarter GDP on July 28th. The Chicago Fed National Activity Index and Kansas City Fed Manufacturing Index were better than expected while the Richmond Fed Manufacturing Index was weaker.
New Home Sales and Existing Home Sales were lower than estimated while Friday’s Durable Goods were down 0.7% but better than expected. The month end reading on consumer sentiment from the University of Michigan held firm at 97.1.
On Tuesday we have the S&P Corelogic Case Shiller Housing Price Index, the Consumer Confidence and the Dallas Fed Manufacturing Index. This is followed Wednesday by the Chicago PMI and Pending Home Sales Index.
In the abbreviated week we have the ADP Employment Report Thursday along with the PMI Manufacturing Index, ISM Manufacturing Index and Construction Spending. This is followed by the monthly jobs report on Friday.
Interest Rates & Commodities
The yield on the 10 Year T-Note was barely higher last week as the ranges narrowed significantly from the previous week. The yield is close to the recent lows in the 2.177-2.191% area as the odds of a Fed rate hike in June are high. There is key resistance in the 2.430% area but the daily and weekly momentum are still negative.
The drop in the crude oil market after the news that the agreement on production cuts had been extended turned the sentiment quite negative. On Thursday July crude had a high of $52 but closed at $48.90. Crude oil had a low of $44.13 on May 5th which was just a three days after my article “Watch For A Bottom In Crude Oil & XOP”.

There were signs at the time that the short side of the crude oil market was getting crowded and the open interest has declined 150,000 contracts in the past eight days. This suggests that many shorts were forced to cover at the highs as they stayed on the short side too long.
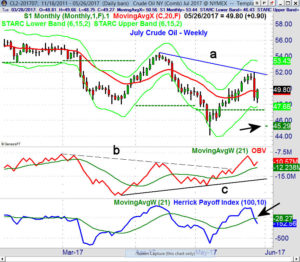
The weekly chart shows that crude dropped below the starc- band at the lows and was just able to rally last week above the 20 week EMA. There is monthly support for May at $47.30 with projected support for June at $45.29.
The weekly OBV has turned down from resistance at line b but is still above its recent lows. The weekly Herrick Payoff Index (HPI) has moved above its WMA and the downtrend, line c. It is still below the zero level. Over the next few weeks there is clearly the potential for crude oil to form a bottom.
Market Wrap
Investors should head into the holiday weekend in an upbeat mood as the market put in a fine performance last week led by 3.8% gain in the Nasdaq 100 and 3.4% rally in the Dow Transports. The Dow Utilities gain of 2.4% completed its trading range as Viper ETF Traders went long the Utilities Sector Select (XLU) near last Monday’s low.
The S&P 500 was up 1.4% while the Dow Industrials gained 1.3% as both again did better than the 1.1% rise in the small cap Russell 2000. The weekly market internals were strong with 1978 stocks advancing and 1115 declining.
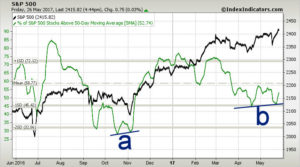

The analysis of the 5 day MA of the % of S&P 500 stocks above their 50 day MA appears to have completed a bottom, line b, at one standard deviation below the mean. A similar bottom was formed last fall, line a, at even more oversold levels.
A move in the 5 day MA above 59% will complete the bottom as it should then move to the 72% which is consistent with even higher prices. The 50 day MA analysis of the Nasdaq 100 shows a similar formation and at 60% could rise above 74% and hit over 80% early in the year.
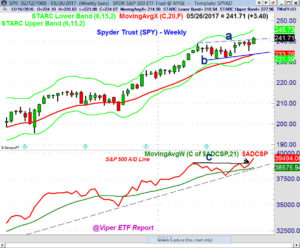

The strong weekly and daily closes in the Spyder Trust (SPY) above the $240 took away the bearish argument of those who were looking for a rally failure in the S&P 500 at 2400. The weekly starc+ band is now at $245.73 with further upside targets at $248 and quarterly pivot resistance at $249.75.
A pullback to the breakout level would not be surprising in the coming weeks with the 20 day EMA at $239.19 and the May low at $235.43. The upside breakout has been confirmed by the move in the S&P 500 A/D line above the resistance at line c as it made significant new highs. In order to weaken the S&P 500 A/D it would need to close below the May 12th low and for its WMA to turn lower.
The Dow Industrials A/D line broke out to the upside last week and the Nasdaq 100 A/D continues to trend higher after breaking out in January. Based on the relative performance analysis the QQQ is still leading the S&P 500 while the iShares Russell 2000 (IWM) is still the weakest.
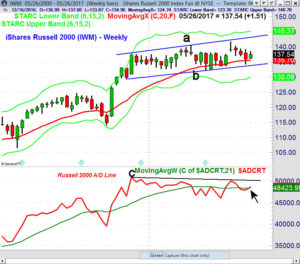

The weekly chart shows that its trading range, lines a and b, is still intact. IWM dropped well below its 20 week EMA two weeks ago before rebounding and it closed higher last week. A weekly close above the resistance at $141.82 should trigger a rally to the $148-$150 area. There is quarterly pivot resistance at $145.37.
The weekly Russell 2000 A/D line has moved back above its flat WMA but is still well below the resistance at line c. The weekly A/D did form a negative divergence at the April high but the monthly A/D line did not. The daily analysis of the A/D line is neutral at best.
What to do? The strong action last Monday in the Spyder Trust (SPY) and the breakout in the S&P 500 A/D line was a bullish development as I Tweeted early Tuesday morning. Nevertheless many on Wall Street are not convinced which is a good sign. Several well-known hedge fund bears are starting to modify their negative views.
It is important to view sharp market declines like what occurred on May 17th in terms of the weekly analysis which has been positive all year and looks even better now. Still it is important to be selective in your ETF or stock purchases.
Viper ETF subscribers are holding a wide range of positions in eleven different ETFs as some are investing and others are trading positions. That includes positions in three overseas ETFs. There are several ETFs that have not yet broken out of their trading ranges so there are still opportunities.
My scans of the Nasdaq 100 and IBD Top 50 stocks have identified a number of good trading opportunities for Viper Hot Stock traders . The long positions in Autodesk (ADSK) were closed out last week for a 23% profit. There were over a dozen new weekly stock buy signals last week and new monthly buy signals will be available during the week.
If you are interested in specific buy and sell advice you might consider a one-month investment of just $34.95 for either the Viper ETF or Viper Hot Stocks service. Both services include two in-depth reports each week and subscriptions can be cancelled on line at any time.
Comments
comments