
Most of the major averages did manage to close higher on Monday despite some early selling. Still the A/D ratios were 3-1 negative with the Dow Transports along with the small and mid-caps losing around 0.5%.
The close last Friday at the daily starc- bands did not favor chasing the short side Monday. As I commented to subscribers of the Viper ETF Report Monday "there were some signs of panic selling but to signal that the market is bottoming we need to see a powerful upside reversal this week."
The S&P futures and Euro zone markets are showing impressive gains in early trading but there is key resistance in the 2050-2067 area. In last week's scan of the Nasdaq 100 and IBD top 50 there were none with positive momentum. The plunge in stock prices has made many holders of the year's best performers like Amazon.com (NFLX) or Netflix. Inc. (NFLX) quite nervous but is that a reasons to sell now?

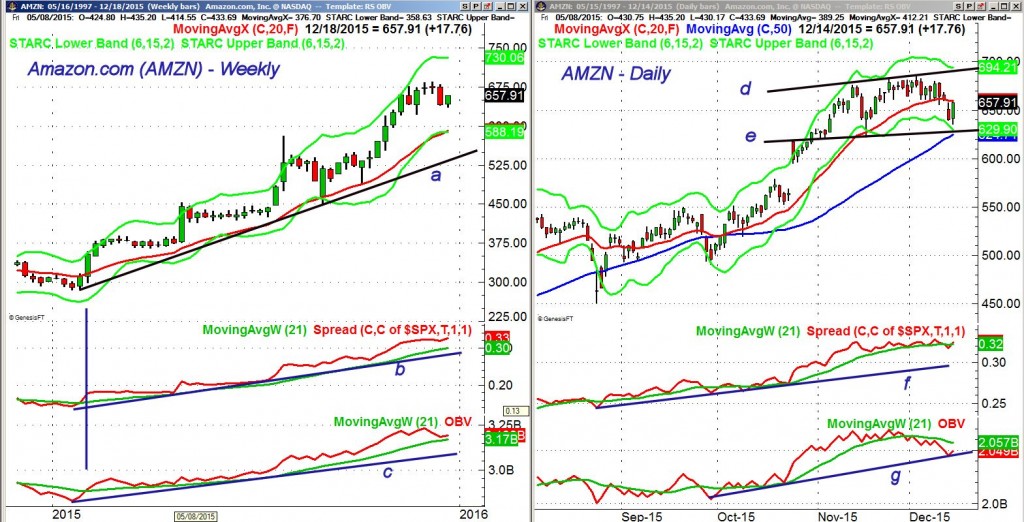
Amazon.com (AMZN) was down about 1.8% in the past week but is still up near 112% for the year. This is impressive when compared to the flat action in the Spyder Trust (SPY) The weekly chart includes Monday's gains and shows that dojis were formed in two of the three past weeks.
- These are a sign of indecision and last Friday's close below the doji lows was a negative sign. A move back above $685.50 is needed to reverse this negative signal..
-There is next support at $622 with the 20 week EMA at $590.60.
-The relative performance analysis ( discussed in last week's You Tube video) has been above its WMA since the start of the year and still looks strong.
-It is well above the long term support at line b which is consistent with a market leader.
-The weekly OBV has also been positive since January and it dropped close to its WMA last week.
The daily chart of AMZN shows a two month trading range, lines d and e, as it came quite close to its starc- band last week.
- AMZN is holding well above the 50 day MA at $624.71.
- The daily RS line is still in an uptrend and moved back above its WMA on Monday.
- The 20 day EMA is at $659.79 with additional short term resistance at $670-$680.
- The daily OBV does look weaker as it dropped below its WMA on Nov. 30th.
- The support at line g has been tested and it is below its declining WMA.
- The volume on a further rally should be watched closely.
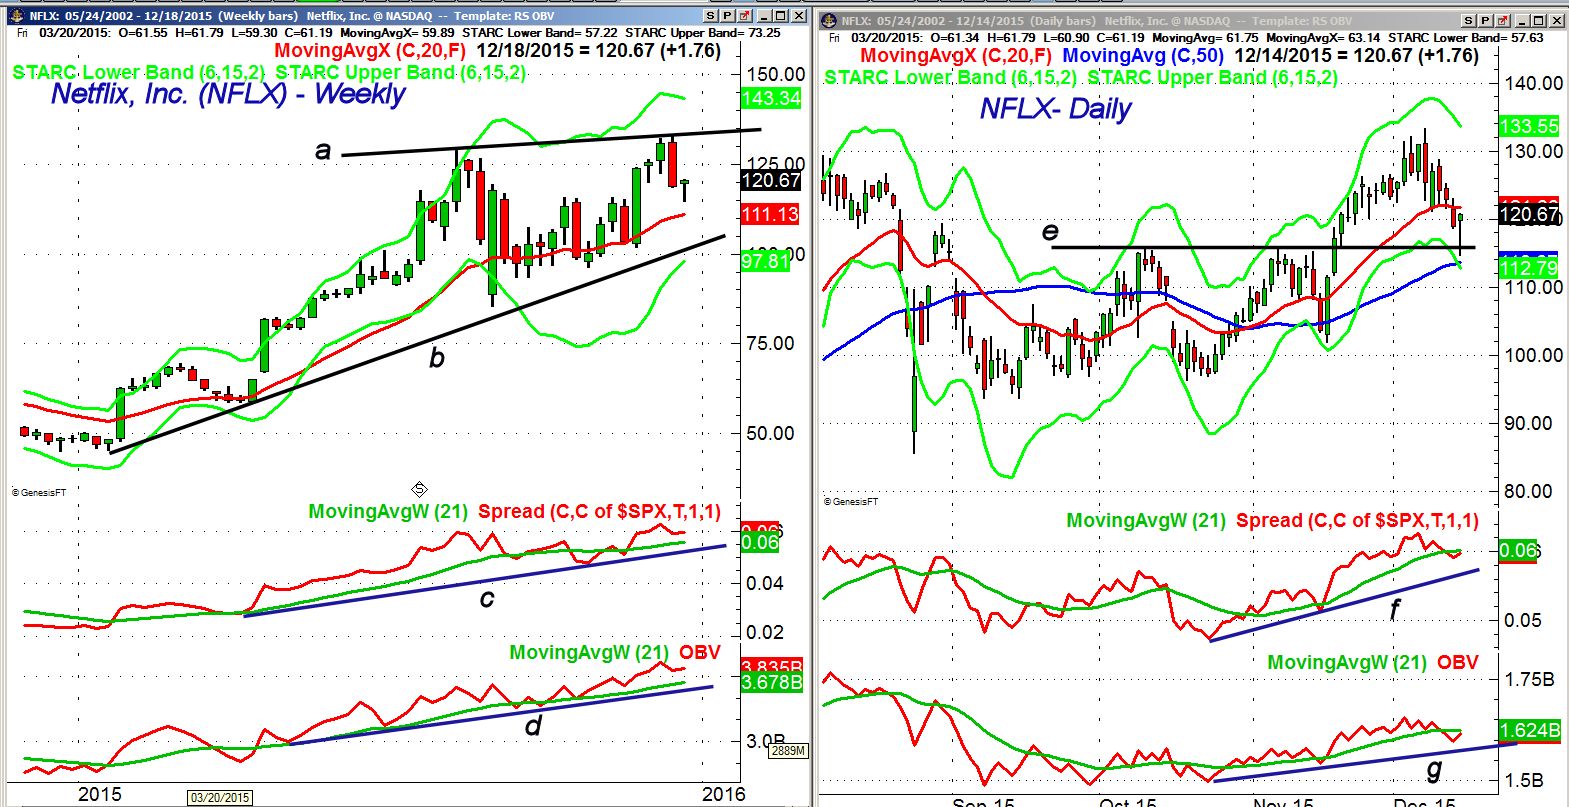
Netflix, Inc. (NFLX) dropped 3.7% in the past week but is still up over 147% YTD. The weekly chart shows the recent pullback from the recent highs, line a, with key resistance now in the $133 area. On a move to new highs the starc+ band is at $143.34.
- The relative performance has been in a clear uptrend in 2015 and made a new high three weeks ago.
- It would take a drop below its WMA and support at line c, to signal that it was no longer a market leader.
- The weekly OBV has also been in a strong uptrend and made a new high just two weeks ago.
- There is important OBV support at line d.
The daily chart shows that NFLX dropped back to good chart support Monday as it had a low of $114.66 before closing near the highs at $120.67. This a good sign and a close back above $125.50 would be a short term positive.
- The daily relative performance dropped below its WMA late last week but is now trying to turn up.
- The RS line is still well above the support at line f.
- The daily OBV is also still below its WMA as volume Monday was average.
- At the recent high the OBV was not as strong as prices.
-The 50 day MA stands at $113.67 with the daily starc- band at $112.79
What to do? As I noted in Friday's Week Ahead column because of the technical damage any rally this week needs to be watched closely especially with the FOMC meeting. The market could accelerate to the upside on an FOMC rate hike but it also possible that this is already factored into the market.
These two stocks have been widely outperforming the Spyder Trust (SPY) and if you have been holding these stocks for their incredible run in 2016 taking some profits or hedging your gains would be a prudent step.
For nimble traders AMZN looks the best for establishing a short term bearish option strategy on a move back to $672-$680area but I would cut your losses on a close back above $685.
Editor's note: If you like Tom's analysis and want specific entry/exit advice on ETFs check out Viper ETF Report his premium newsletter.
Comments
comments