

Monday's lackluster stock market performance was followed by a broadly based rally on Tuesday that was accompanied by very strong market internals. On the NYSE the advancing stocks led the decliners by over a 3 to 1 margin.
The advance/decline lines had been in a corrective mode for several weeks but as I detailed in last week's Market Wrap section there were some key signs that I was looking for to indicate that the market was ready to move from the corrective to the positive mode. When the A/D lines are rising strongly which was the case in February when many traders were bearish ETFs and stocks can rise impressively.
While the A/D lines have now moved above their initial resistance levels it will still take a few more days of positive numbers to confirm that the market has resumed it positive intermediate trend. There were signs last week that the PowerShares QQQ Trust (QQQ), which had been lagging the Spyder Trust (SPY), was starting to become a market leader.
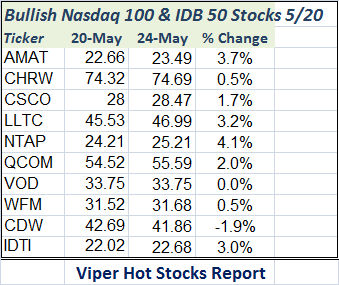
In the week ending last Friday, May 20th the PowerShares QQQ Trust (QQQ) had gained twice as much as the Spyder Trust (SPY) and this was picked on in my relative performance analysis. Part of my weekly Viper Hot Stocks scan is to look for those stocks that are leading or lagging the overall market. In the scan from last weekend these ten stocks were on the buy list and several are already showing nice gains this week.
In today's column I will update the outlook for the PowerShares QQQ Trust (QQQ) and also demonstrate the methods investors and traders can use to find those best of breed stocks that are likely to outperform the market.
The PowerShares QQQ Trust (QQQ) had a wide range Tuesday and is not far below the daily starc+ band at $108.46. It was a positive sign last week that the quarterly pivot at $104.74 was tested but held on a closing basis.
- The daily downtrend, line a, is in the $110-$111 area with monthly pivot resistance at $114.64.
- The Nasdaq 100 A/D line based out last week at support, line b, but was still in the corrective mode.
- With Tuesday's close the A/D line has moved above its WMA and the May 10th high, point 1.
- The A/D line now needs a pullback and another high to confirm a new uptrend which seems very likely.
- The daily relative performance moved above its WMA on May 13th (point 1) and turned more positive late last week.
- The weekly RS line is rising but still below its WMA.
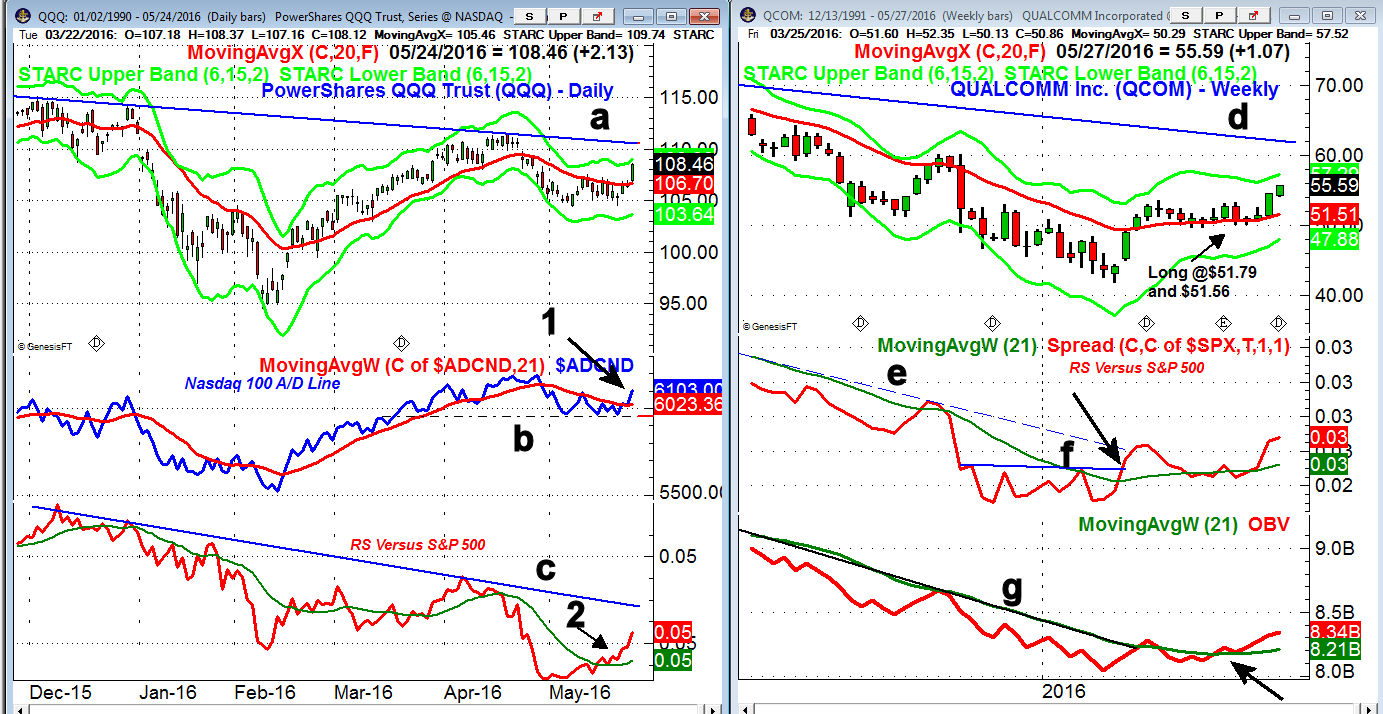
QUALCOMM Inc. (QCOM) has been on my radar since February when the weekly relative performance moved above its resistance at line f. This signaled that it was now a market leader. It formed a short term top in March and then moved sideways for eight weeks as it tested the flat 20 week EMA.
- It was recommended in late April when it turned up in my scan as of the close on April 22nd.
- The weekly starc+ band is at $56.67 with more important resistance in the $60 area.
- The RS line held its WMA as prices were consolidating and looks ready to make a new high this week.
- The OBV moved back above its WMA in late April and has now moved above its prior peak.
- The daily studies are strong with the 20 day EMA at $52.88.
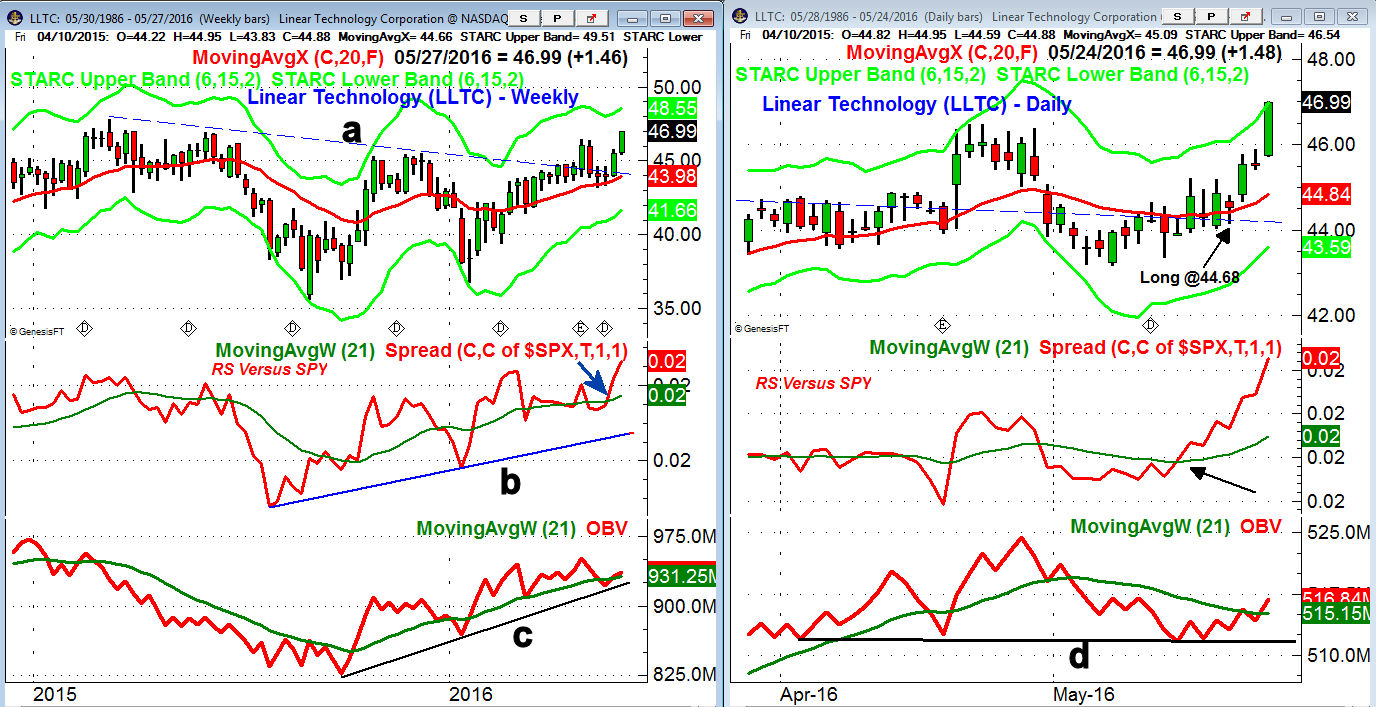
Linear Technology (LLTC) is a specialized semiconductor company which broke through major resistance, line a, in April. It formed double dojis the first two weeks in May and started to turn higher last week.
- With this week's action Linear Technology (LLTC) is now closer to the weekly starc+ band at $48.60.
- The quarterly pivot résistance is at $49.41 with additional upside targets in the $54-$56 area.
- The weekly RS line moved strongly above its WMA last week and was much stronger than prices at the February lows, line b.
- The pattern of higher lows in the OBV, line c, was a sign of accumulation as it closed back above its WMA last week.
- Good weekly support at $43.98 and the rising 20 week EMA
The daily chart of Linear Technology (LLTC) shows the choppy trading at the start of May as the drop from the April highs stopped me out of earlier longs for a 4% profit.
- The daily RS moved above its WMA on May 13th and by last week it was rising strongly.
- New longs were recommended on last Thursday's open and the RS line has continued to accelerate to the upside.
- The Tuesday close was above the daily starc+ band so we may see some consolidation or a pullback over the near term.
- The daily OBV turned higher from support at line d, and is above it WMA. It is still below the April highs.
- There is initial daily support now at $5.50-$46 with the 20 day EMA at $44.84.
Summary: The relative performance or RS analysis can be run on a number of free sites and on www.freestockcharts.com you can also run a 21 period moving average on the RS as I do. Of course with all types of analysis one should look at multiple time frames. This analysis also plays an integral role in the ETF selection process and led to Monday's recommendation of the SPDR S&P Bank ETF (KBE).
The stock market opened strong again early Wednesday as the S&P 500 looks ready to test the 2100 area. I would be looking for a pullback in the next few days and if the A/D lines do confirm new positive trends it should be a buying opportunity.
Two trading lessons that explain my method of A/D analysis were sent out to clients of the Viper ETF Report and Viper Hot Stocks report last week. They are also sent out to all new subscribers.
Comments
comments