

The rebound from the lows last Wednesday and early Thursday have once again reinforced the merits of being as objective and non-emotional as possible. Last Wednesday most of the major averages and the ETFs that track them closed below the daily starc bands.
This meant that this was a high risk time to sell and as a result new short positions in an inverse ETFs were not recommended to Viper ETF traders. The strength of the rally from last week’s lows has made it painful for those who went short on last Thursday’s open.
In my weekend column “Sidestep The Trump Traumas” I focused on why you should focus on using hard data to guide their investments or trades as it will help you avoid reacting emotionally. This is why I favor technical over fundamental analysis.
Many traders use pivot point analysis to determine their entries and exits but in today’s column I want to show you how they can often be used to identify new market trends with just one calculation per month. Like most methods of analysis it does not work 100% of the time but it can generate powerful signals in many markets as the monthly pivot has been rising all year in the PowerShares QQQ Trust (QQQ).
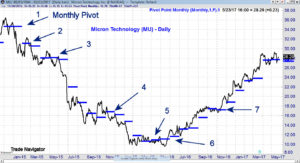

This chart of Micron Technology (MU) goes back to early 2015 and the solid blue lines represent the monthly pivot levels. In December of 2014 and January of 2015 the monthly pivots were at $34.62 and $34.66, point 1. In February the monthly pivot dropped to $31.10 which was a significant drop from the prior two months (point 2).
This change in the trend of monthly pivots was confirmed in March as the pivot was again lower at $30.53. This was consistent with the relative performance (RS) analysis that compares the performance of Micron Technology (MU) to the Spyder Trust (SPY). It had topped out in the middle of January as it had dropped well below its weekly WMA. This was a sign that MU was now acting weaker than SPY.
Based on March’s data the April monthly pivot again dropped sharply to $28.08 and was unchanged in May, point 3. The chart shows that the monthly pivot continued to decline through October but rose in November, point 4, to $16.79 which was up from the prior month’s reading of $15.62.
When the monthly pivot breaks a trend of lower highs or higher highs then one needs to examine the chart and simple technical indicators like the 20 day EMA. It topped out in the middle of October and by the start of November it was in a clear downtrend.
In December 2015 the monthly pivot had one again declined to $16.21 and dropped for the next three months as it was at $10.61 in March. In April it rose to $10.92 and was even higher at $11.07 in May 2016. Two months of a rising monthly pivot was a sign that the trend could be changing from down to up.
The sharp rally at the start of June had a high of $13.21 took prices well above the prior three month high from March at $11.78. This was also consistent with the formation of a bottom. In the middle of June MU pulled back to $11.95 which was the June pivot as well as the breakout level.
The monthly pivots rose through October when the monthly pivot was at $17.42. It declined in November to $17.22 (point 7) as MU formed a continuation pattern which is consistent with a pause in the uptrend. The flag formation was completed on November 11th which indicated that the uptrend had resumed.
The monthly pivot was sharply higher In December and has continued to make higher highs so far in 2017. For May the monthly pivot is at $27.69 and Micron Technology (MU) is part of the Viper Hot Stocks portfolio.
If you would like to keep up with my market analysis and see future examples of monthly pivot analysis you call follow me on the Viper Report Facebook page.
Comments
comments