

Editor's note: If you like Tom's analysis of the A/D line and want specific entry/exit advice on ETFs check out Viper ETF Report his premium newsletter.
Stock traders might take a look at Tom's Viper Hot Stocks report which is updated twice a week with specific signals on the Nasdaq 100 and IBD top 50 stocks.
The global stock markets have certainly gotten the world's attention after just five days of trading in 2016. Even the very strong job report on Friday just triggered a brief bounce as stocks ended the week on the lows
Most investors will be looking at their brokerage or 401k accounts this weekend and trying to figure out what they should do with their investments in 2016. I was certainly not expecting this severe a decline but it does not change the approach I feel investors should take with their investments.
Portfolio decisions in 2016 are especially difficult in 2016 after the relative flat performance in 2015 by the S&P 500 and the 6.8% decline in junk bond ETFs like the SPDR Barclays High Yield ETF (JNK). Even the Barclays U.S. Aggregate Bond Index was only up a paltry 0.80%.
There are three questions I think investors should ask themselves this weekend. First let's look at last week's market action.
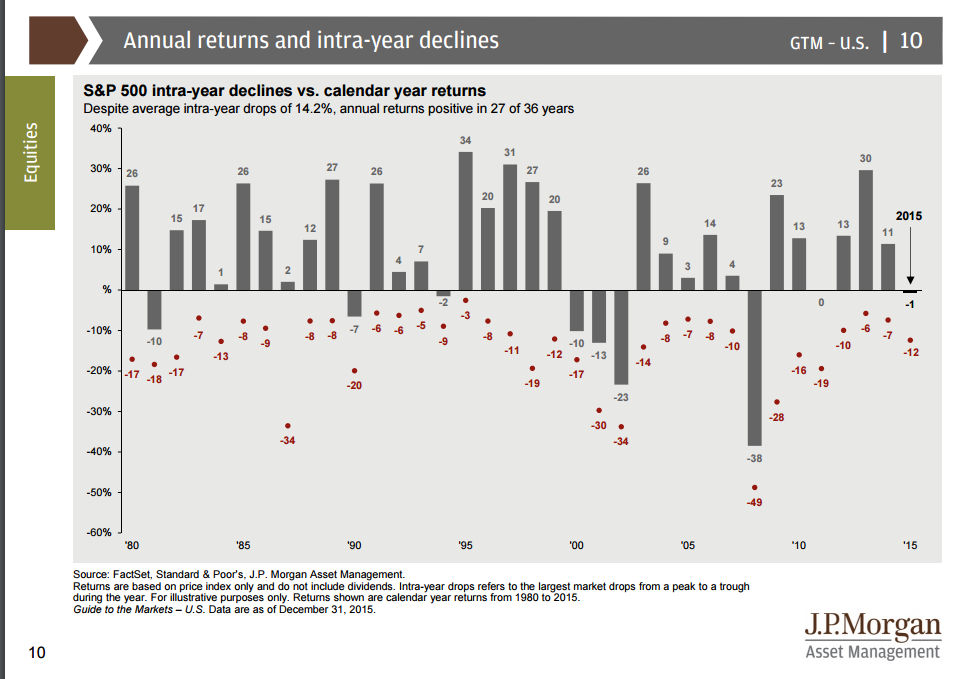
The S&P 500 tracking Spyder Trust (SPY) lost 5.8% this week. This interesting chart and data from Factset/JPMoran Chase Asset Management indicates that since 1980 the S&P 500 has had "average intra-year drops of 14.2%" with positive annual returns in 27 of 35 years. This implies we could lose another 8.4% and still have a 75% chance of finishing higher.
During Monday's trading session many commented that this could be the worst first day of the year since the 1.8% drop 1932. By the close the S&P 500 was down 1.5%. Still this was the worst first week of the year.
On the first day of trading in 2001 the S&P 500 was down 1.8% but as the chart shows this drop was followed by a sharply higher close the next day and a rally of 8.5% by the end of the month. In 2001 the market was in a solid downtrend unlike 2016 and the S&P 500 just tested it's downtrend in 2001 before moving much lower.

The current decline I think needs to be viewed in terms of the long term monthly charts. The chart has support from the 2014-2015 lows (red line) at 1885. The 2015 summer lows were at 1867 which is 2.8% below last Friday's close. The still rising 40 week MA is at 1849 and the last time it was tested was in 2010. The October 2014 low at 1814 which is about 5.6% lower.
The completion of the major monthly trading range, lines a and b, in May 2013 still has long term significance. To those not comfortable with technical analysis this may seem farfetched but the upside targets from this range are in the 2500 area. When IBM completed its monthly trading range in 2010 my upside target was in the $160-$170 area. It eventually moved to $200.
The first question is ask yourself is whether last week's market's decline caused you to sell any holdings that you had planned to hold all year?
If the answer is yes then that is a sign that you had too large a % of your portfolio in stocks. Some are comfortable with 70% in stocks during such a decline while others are scared into selling with only 30-40%. Everyone has a different comfort level so decide what yours is and act accordingly. Don't decide to change your allocation if the Dow opens 400 points lower one day.
If you have raised some cash I would suggest you wait before investing it in something new. As I discuss later I think the next 3-5 weeks will tell us more about 2016.
The Economy
The sluggish action of the stock market in 2015 and the current market drop reflect the mixed view that analysts and investors have on the economy. Some feel that are in or are starting a recession while others feel the economy is still healthy.
Each week I review many of the economic indicators and in my work the Leading Indicators (LEI) is the best at warning of a recession. It rose 0.4% in November and December's data will be released on January 22nd. It typically tops out well ahead of a recession as it turned lower twenty months before the last recession and ten months before the 2000 recession. Typically bear markets warn of a recession.
The second question investors should answer is what economic indicators will you use to determine your outlook for the economy?
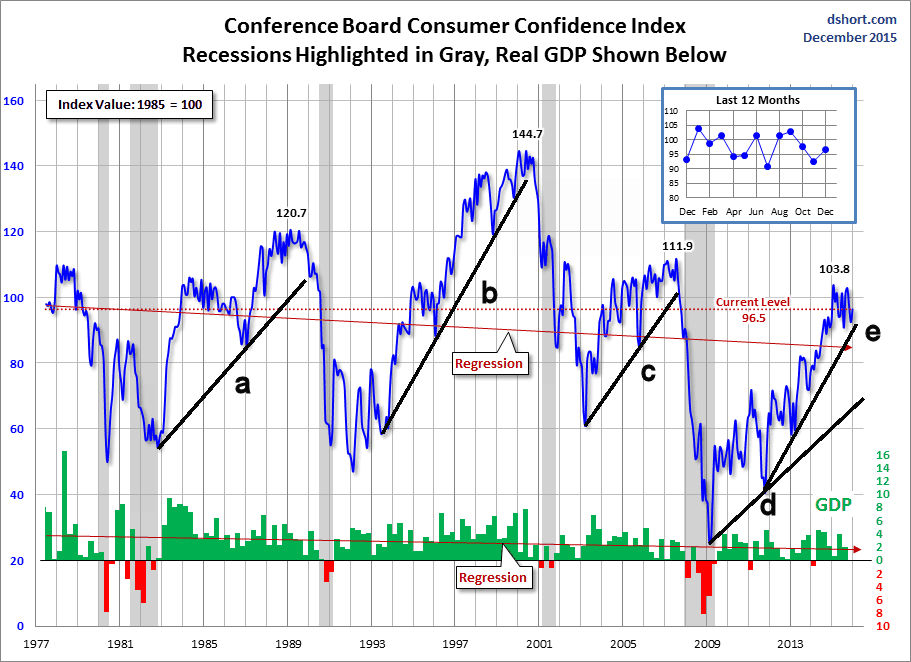
As I have been noting since last spring the data has been mixed which explains the differing views. The data on the consumer has been generally strong. One measure is the Conference Board's Consumer Confidence which was strong last month at 96.5. Let's look at how it performed during past recessions.
Prior to the 1990 recession the Consumer Confidence broke support, line a, well ahead of the recession. This measure of the consumer stayed strong from 1993 through 2000 when it also dropped below its support (line b).
During the recovery from the 2000 recession the Consumer Confidence was much weaker as it peaked at 111.9 before dropping sharply in late 2007. It is currently well above the long term uptrend from the 2010 low, line d. However the steep, shorter term support, line e, is not far below current levels. I will be watching it in the months ahead.
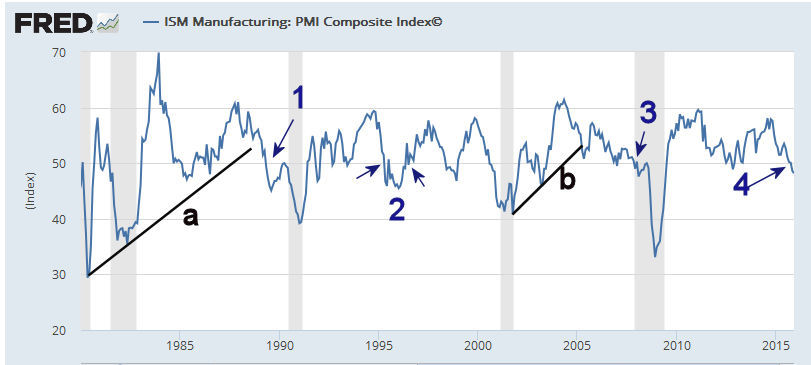
Most of the negative economic news has been from the manufacturing sector. This is reflected in the ISM Manufacturing PMI Composite Index which dropped below 50 over the past two months. if you want to explore this data more closely go to the St Louis Fed site.
Prior to the 1990 recession the index dropped below 50 in May 1989 several months after it dropped below support, line a. From January 1993 through 2000 it was much choppier as it moved above and below the 50 level several times. Finally in November 2000 it dropped below the prior lows, point 2. This was four months before the start of the recession.
Before the 2008 recession the support in the index was broken in 2005 and it did not drop below the 50 level until December 2007 as the recession was starting. The ISM Index formed lower highs in 2014 which is not a positive sign and neither is the recent drop below the 2012 low. It needs to see a sharp rebound in the next few months in order to reverse it's negative trend.
The calendar this week is light with most of the data coming on Friday including; PPI, Retail Sales, the Empire State Manufacturing Survey, Industrial Production, Consumer Sentiment and Business Inventories. The mid-month reading on Consumer Sentiment could take quite a hit after last week in the stock market.
Interest Rates & Commodities
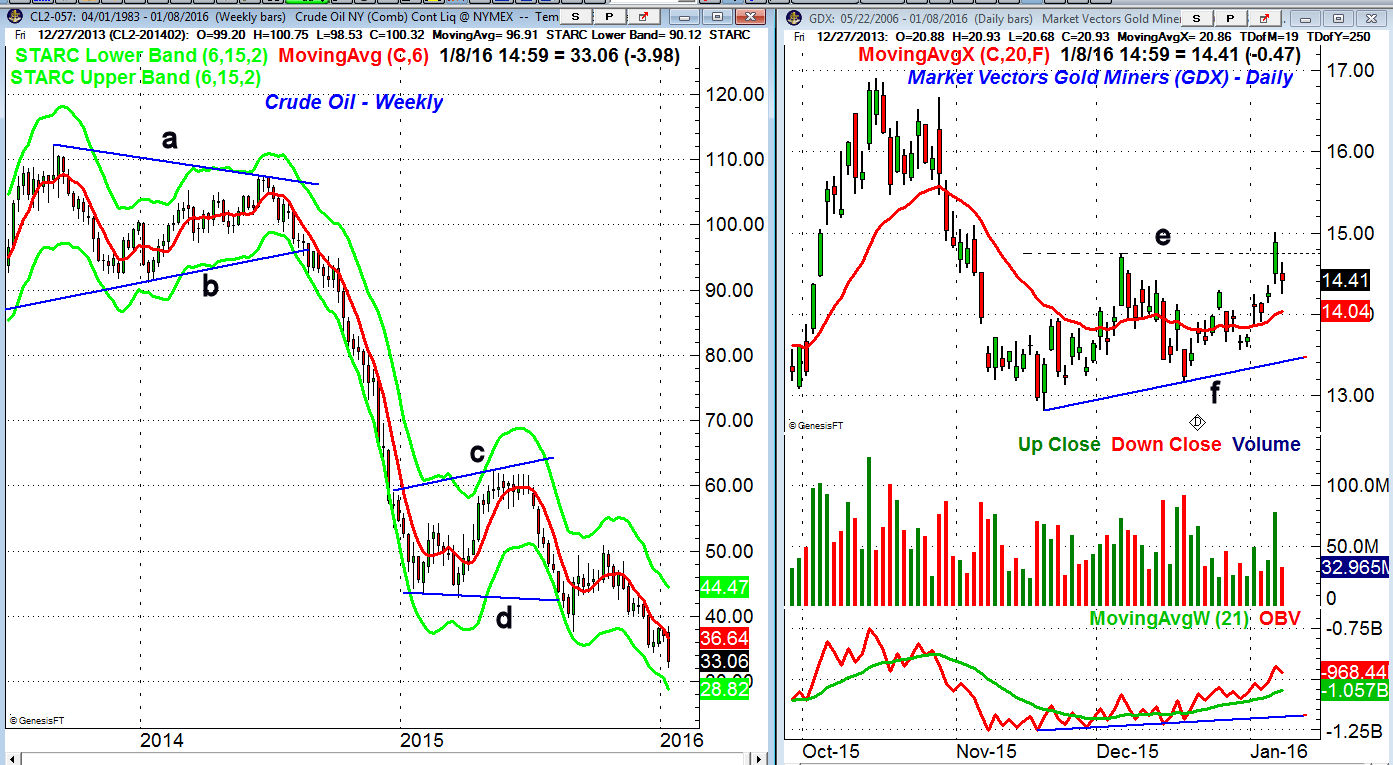
It was another ugly week for crude oil as it lost another $4 a barrel for the week. Despite the high level of bearish sentiment and heavy short position the rallies have been very brief. The bad news is that it is still well above the weekly starc- band which is now at $28.79. The daily studies are oversold so a bounce back to the $40 level would not be surprising in the next two months.
Gold was up 4% for the week and the Spyder Gold Trust (GLD) has next strong resistance in the $107.50-$108.50 area. The Market Vectors Gold Miners (GDX) had a good week as it overcame the daily chart resistance at $14.73. There is next resistance in the $15.45-$16.50 area. The daily OBV still shows a bottoming formation and volume was strong on last Thursday's surge.
The yield on the 10 Year T-Note closed down 1% for the week at 2.13%. The weekly and daily technical studies are starting to favor lower yields. A drop below the 1.900% level would be a sign of even lower yields.
The final question investors should answer is if you are planning to make changes to their portfolio after last week's action. I hope the market wrap section will help you develop a well informed portfolio plan.
Market Wrap
The 20+ point rally in the S&P futures after the surprisingly strong jobs report dissipated in the first two hours of trading and the selling continued all Friday. The Russell 2000 dropped the most losing 7.9% for the week followed by a 7.5% loss in the Dow Transports. The S&P 500, Dow Industrials and NYSE Composite all lost around 6% as it was the worst weekly decline since September 2011. There were 2502 declining stocks with just 725 advancing.
According to AAII only 22.2% of individual investors are now bullish and in this week's survey we could see a drop below 20%. The bearish % jumped 14.6% to 38.2%. During the August-October 2011 correction the bearish% came close to 50%. The CNN Fear and Greed Index closed the week at 17 well in fear territory as it was neutral a week ago. At the August 2014 lows is was in single digits.
All of the major averages are very oversold as the NYSE Composite and Spyder Trust (SPY) both closed the week 5% below their 20 day EMAs. Last Thursday and Friday the averages also closed below their daily starc- bands and the SPY even closed below its weekly starc- band.
Many were looking for the start of an oversold rally on Friday but the failure of the market to rally soured the sentiment even further. Nevertheless the odds still favor a strong rally this week.
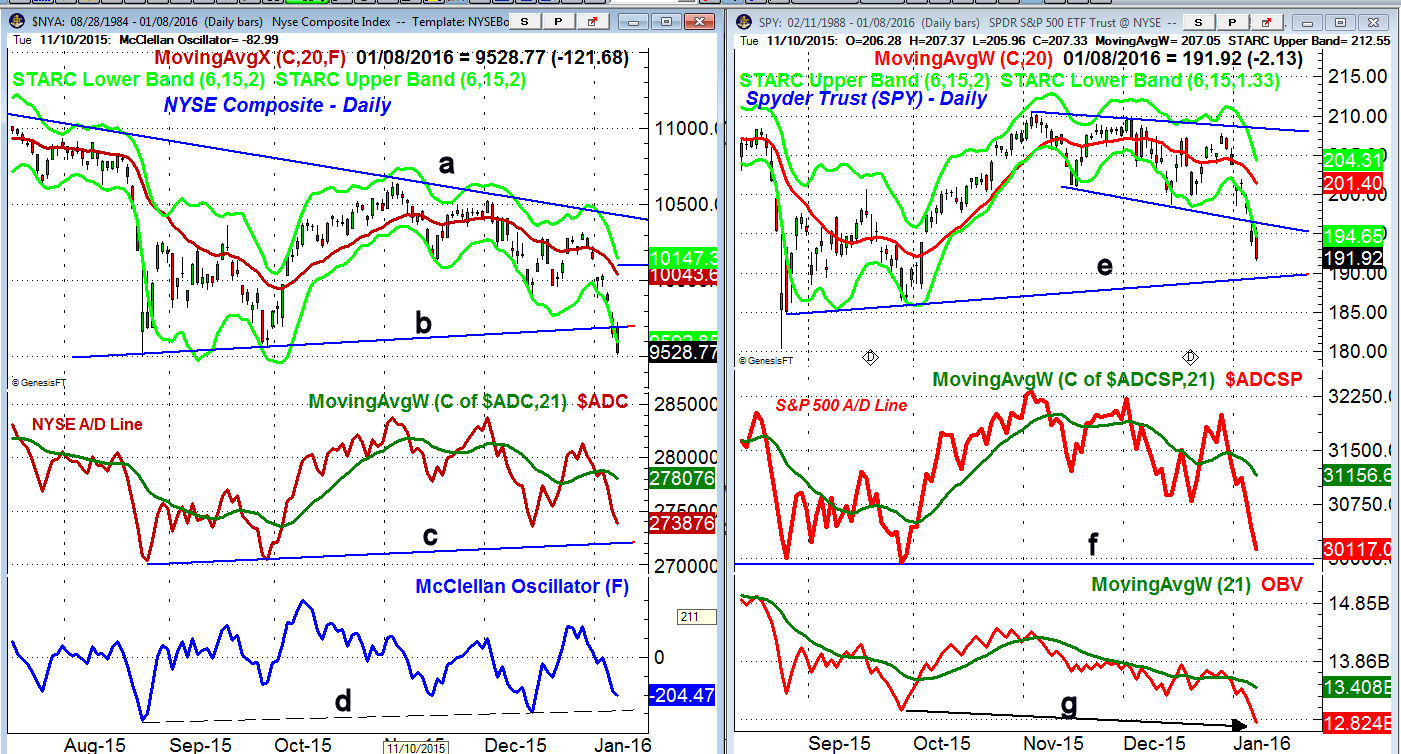
The daily chart of the NYSE Composite shows that it closed below the support from the August and September lows, line b. The weekly starc- band is now at 9412 with further support in the 9250 area. A rally should reach at least the 9880-9940 area and could test the 20 day EMA at 10043.
The NYSE A/D line closed 1.5% below its 21 WMA but is still slightly above the December lows. The bullish divergence support, line c, is now a more important level to watch. The McClellan oscillator closed the week at -204 but is also above the long term support at line d.
The Spyder Trust (SPY) looks weaker technically than the NYSE Composite with next support in the $190 area. There is additional support at $188.62 and then at $185.82 which was the late September low.
There is first resistance in the $196.50-$197.40 area and then at $200. The declining 20 day EMA is at $201.40. It would take a close back above the $208 area to reverse the technical damage.
The S&P 500 A/D line has plunged and is now as far below its WMA as it was in late August. It looks as though the A/D line is ready to test the September lows, line f. The daily OBV is acting weaker than prices as it has formed lower lows, line g.
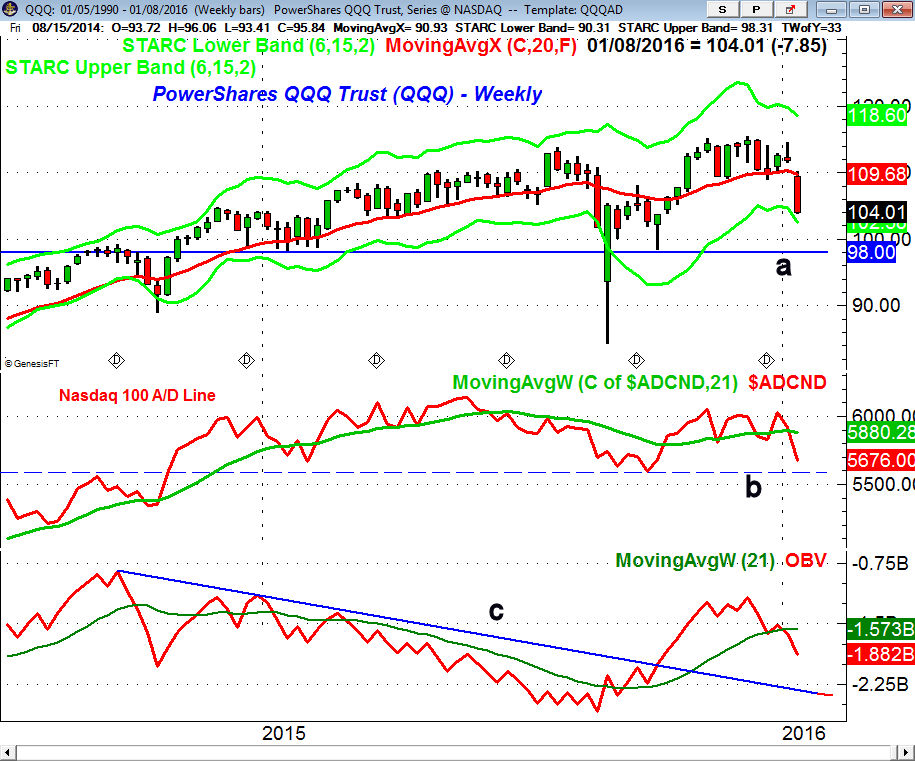
The tech and biotech sectors were hit hard last week as the PowerShares QQQ Trust (QQQ) lost 7%. The weekly starc- band is now at $102.58. There is more important support now at $98 but the QQQ did hit a panic low of $84.28 on August 24th. There is first resistance at $108 with the 20 day EMA at $110.31. The gap from the open last Monday has resistance at $111.84. A daily close above $114.25 is needed to reverse the technical damage.
The Nasdaq 100 A/D line has reversed sharply from the late 2015 high as it has dropped well below the November-December lows. The more important support now stands at line c and a drop below the 2015 lows would be a clear sign of weakness.
The iShares Russell 2000 is getting close to the August 24th low of $101.67 with the uptrend from the 2012 lows now at $100. The Russell 2000 A/D line has dropped below the August lows and is now close to the lows from October 2014.
What to do?
Given the technical damage and the deeply oversold status of the market the expected rebound is likely to last more than 2-3 days and the averages could even make it back to their 20 day EMAs. In my opinion it is more likely that the rally will ultimately stall as the averages will then see another wave of selling before a bottom could be completed. The A/D numbers will need to be watched close on the rally.
I think the S&P 500 could drop to the 1845-1870 area before the correction is over. If the rally is short lived an important low could be formed sooner.
There are no signs yet of a recession so the monthly chart formations are likely part of a broad continuation pattern that will ultimately set the stage for a move to new highs. This outlook could change later in the year if the earlier discussed economic data deteriorates further.
One cannot totally dismiss the possibility that the markets will now rally sharply enough to complete weekly bottom formations. This would mean a test of the all time highs but it would likely take a very strong earnings season, especially for the financials along with stabilization in China and the crude oil markets.
My smoothing analysis of the S&P 500 stocks below their 50 day MAs has reached one of the lowest levels since 2011. This is supported by the analysis of Michael Hartnett, chief investment strategist at Bank of America Merrill Lynch. His work shows that 88% of the global equity markets are trading below their 200- and 50-day moving averages. They are both signs of a very oversold market.
If you have decided to reduce your equity exposure you should get a good opportunity in the next week or two to sell down to your comfort level. Of course there are few non-equity investment opportunities that look attractive so money market looks best.
Those who are looking out a few year the equity markets are clearly the best place to be even if we see another decline of 5% or so in the first quarter. A dollar cost averaging plan in a low cost ETF or mutual fund where you have no transaction fees is preferred.
At the end of 2015 there were signs from the monthly charts that the large cap stocks, contained in ETFs like the SPDR Dow Industrials (DIA) or Vanguard Large-Cap ETF (VV) are starting to outperform the S&P 500. often in teh latter stages of a bull market the large caps do perform the best
The bottom line is that you should have a first plan of action for what is likely to be a volatile earning's season and be sure you stay with your plan.
Comments
comments