Editor's note: If you like Tom's analysis, check out
ViperETF.com, his premium newsletter.
For an already weak stock market the poor jobs report on Friday put the sellers back in charge in early trading as the Dow was quickly down 258 points. The initial selling in reaction to the new concerns over the economy was met with good buying as the major averages spent the rest of the day moving higher.
The Dow industrials was able to close 200 points higher on Friday and managed a gain of 0.97% for the week. The S&P 500 was up over 1% while the small cap Russell 200 finished the week with a loss of 0.8%. The NYSE Composite gained almost 1.2% for the week but still there were 400 more stock declining than advancing. As I discuss in the Market Wrap section there is technical evidence now that Friday's reversal was important.
The jobs data is suggesting that we may not see a rate hike this year which increase the anger of many analysts who fear that by waiting the Fed will not be able to combat an increase in inflationary pressures. Some of the same experts have been attacking the stimulus plan since the financial crisis. They have been warning about ballooning debt and an inflationary surge.
As I commented in October 2012 "The fiscal conservatives favor more austerity, as they conclude that our increasing debt levels have to result in much higher inflation. Many are hoping that this will be like 1980, when Reagan’s election spawned a 20-year bull market."

Few realize that in terms of percentage change Reagan by far had the greatest percentage increase in public debt than any of the other past eight presidents. Though his term is not yet over it seems unlikely that Obama will surpass his predecessor before he leaves office.
After following the Japanese economy and stock market since it peaked in 1989 I have always been more concerned about deflation. The report early Friday that Euro zone Producer prices had dropped 2.6% from a year ago suggests that this is a valid concern. Euro factory prices also dropped more than expected.
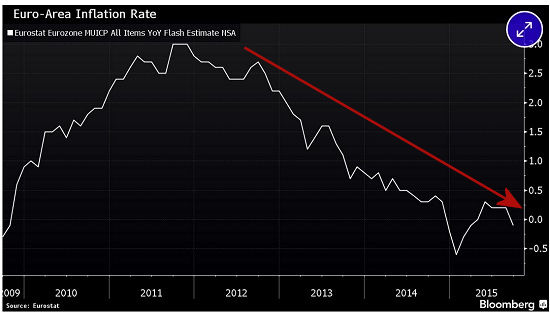
It was also reported by Eurostat last Wednesday that consumer prices on an annual basis fell in September for the first time since the ECB began its stimulus program. Weak data from purchasing managers caused Chris Williamson, chief economist at Markit to comment that “Deflation worries will intensify and put pressure on the ECB to act more aggressively.” The Euro zone inflation rate is still in a clear downtrend and well below its target level of 2%.
Several emerging market central bankers are also hoping the Fed will raise rates but higher US rates are likely to put even more pressure on their already weak currencies and economies. So far in 2015 over $500 billion has flowed out of emerging markets.
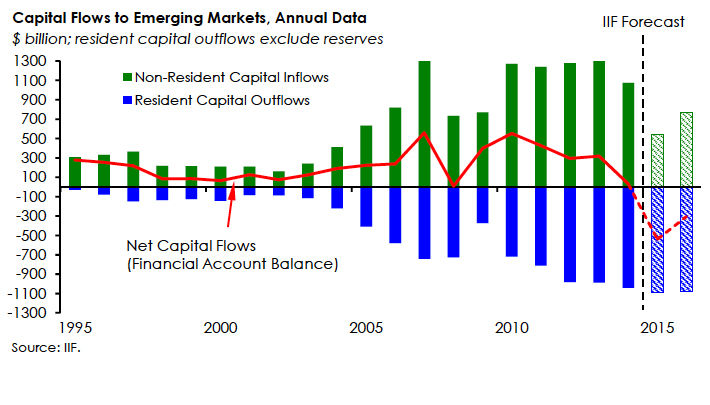
In fact on Thursday the Institute of International Finance projected that capital inflows to the emerging markets will turn negative this year for the first time since the late 1980's. Both the ECB and Federal Reserve have already expressed their concerns that this could be even more of a drag on the US economy.
The Economy

Given these global economic pressure the disappointing jobs data for September and the downward revisions of the previous months further raised the concerns of investors. This has pushed the average monthly change in non-farm payrolls well below the 2014 average which is not an encouraging trend.
The jobs data is normally quite volatile and while one should not place too much importance on any one month it does make the jobs data in the next few months much more important. It was not surprising that most of last week's data on the US economy last week was weaker than expected.
Pending Home Sales fell 1.4% in August and the S&P Case Shiller Housing Price Index also declined in July. With the downward revision of June's report this is the third declining month in a row.
The manufacturing data continues to be disappointing as last Monday the Dallas Fed Manufacturing Survey was quite weak at -9.5. The Chicago PMI on Wednesday dropped below 50 while the ISM Manufacturing Index dropped to 50.2.
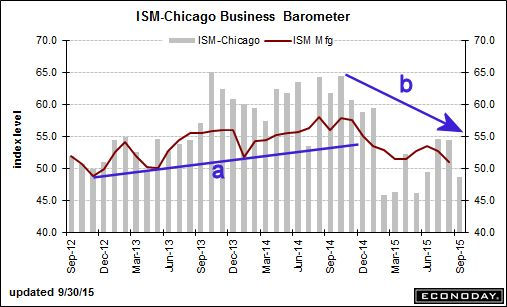
This was the lowest reading since March 2013 with new orders at the lowest level since 2012. The chart of the ISM Manufacturing shows that the support from 2012, line a, was broken early in the year. With the latest reading it now is in a short term downtrend. The ISM for Chicago also peaked about a year ago and has formed lower highs (line b). The readings for the rest of 2015 will be important.
The one bright spot was the Consumer Confidence for September at 103 as it was better than expected 96.0 reading. Both it and the NFIB Small Business Optimism Index are still in their up trends. It would take a drop below the 2014 lows to call these trends into question.
This week we have the ISM Non-Manufacturing Index along with the PMI Services Index on Monday. Over the past few months the services data has been better than manufacturing with the ISM at 59 last month.
The latest report on International Trade is out on Tuesday with the release of the FOMC minutes on Thursday. September Import and Export prices are out on Friday and they are often give one a good reading on inflation.
Interest Rates & Commodities
In reaction to the jobs report the yield on the 10 Year T-Note dropped below 2.00% which the weekly/daily technical studies have been suggesting for several weeks.
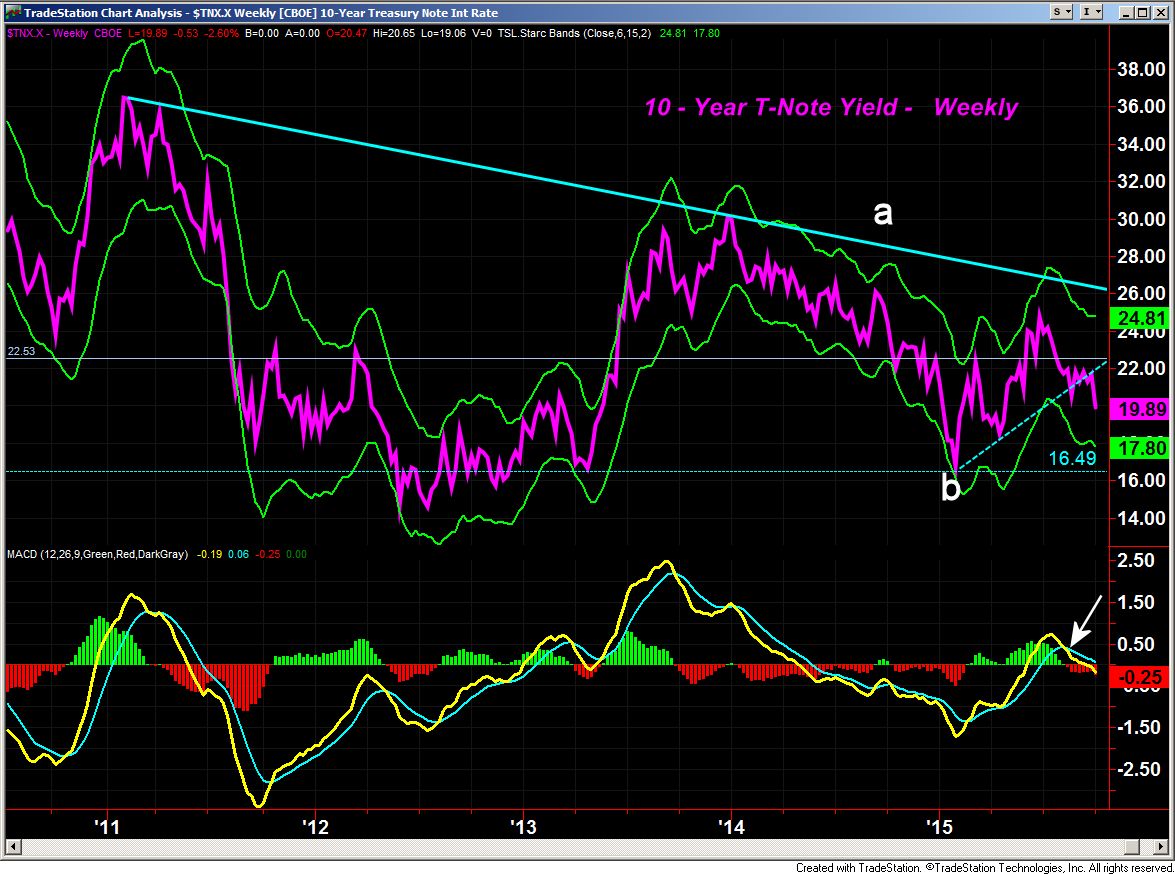
The weekly starc- band stands at 1.780% with the next strong support at 1.649%.
The short term support on the yield chart, line b, was broken about seven weeks ago. This coincided with a negative signal from the MACD and MACD-His. As I noted last week the daily studies had also turned back to negative.
The commodity markets stabilized late in the week as the 30% plunge in the price of commodity giant Glencore last Monday certainly had the market's concerned. The dramatic widening of their credit default spreads called into question the viability of the company.
Gold prices rallied sharply on Friday but there was little improvement in the weekly technical outlook that was discussed last week. For the SPDR Gold Trust (GLD) there is key resistance in the $112 area.
Crude oil managed to close higher for the week as prices have been in a trading range for the past month. A daily close in the December contract above $48.50 would be a positive sign.
Market Wrap
The sentiment picture did improve a bit last week as the % of bearish investors according to AAII jumped over 10 points last week as 39.9% are now bearish. The bullish% dropped to 28.1% but is still above historically low levels in the 20-22% area.
According to option expert Larry McMillan the Total put-call ratio "has also generated a buy signal, and that is usually a powerful one – calling for an $SPX rise of at least 100 points". A very high level of put buying is a sign of very high bearish sentiment.

The daily chart of the NYSE Composite shows Friday's close above the 20 day EMA which is trying to flatten out. A weekly close back above the quarterly pivot at 10,113 would be a positive sign with further resistance now at 10,250. The daily downtrend, line a, and the quarterly pivot resistance stands in the 10,628-10,718 area. This is 6.6% above Friday's close.
The new closing low in the NYSE on Monday was accompanied by a higher low in the NYSE A/D line as noted by line e. This bullish divergence is what one would typically see at a market low. The A/D ratios ended 3-1 positive on Friday which has pushed the A/D line above its WMA. To confirm the bullish divergence the A/D line now needs to move above the downtrend, line c, and the September high.
The McClellan oscillator has also formed a significant bullish divergence as it has made sharply higher lows, line g. A move above the resistance at line f, will confirm the divergence. When using divergence analysis it is important to focus on the closing prices not the intra-day highs or lows.
Over the past 30 years I have relied on the NYSE A/D line to determine the market's trend as the A/D line data on the S&P 500, Dow Industrials, Nasdaq 100 and Russell 2000 has only been available since 2009. These A/D lines did not form bullish divergences last week but have turned up sharply.
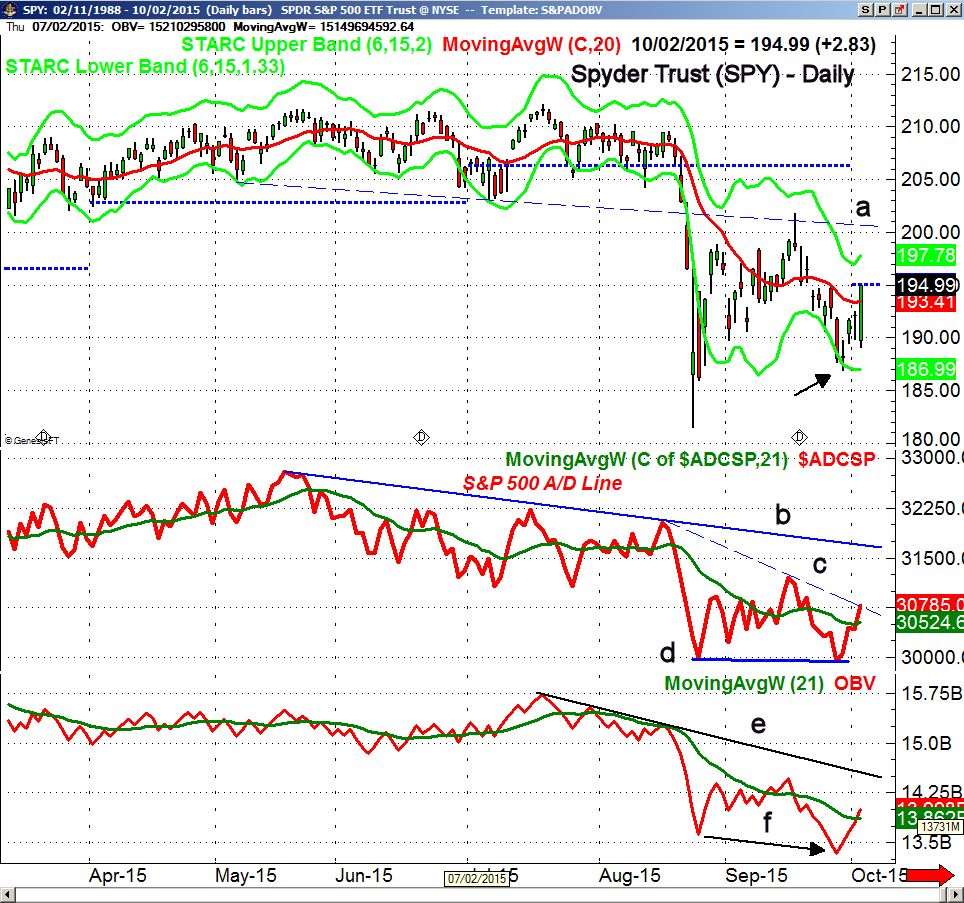
The Spyder Trust (SPY) closed well above the 20 day EMA at $193.41 with next chart resistance, line a, in the $200.50 area. The close was just below the quarterly pivot at $195.06 so this week's close will be important. There is short term support now at $189.12 which was Friday's low. A close back below this level would be negative.
The SPY formed a doji on Tuesday at the daily starc- band as it was in a high risk sell area. The Wednesday's close above the doji high triggered a high close doji buy signal. The SPY did not make a new closing low last week and the S&P 500 A/D line did make slightly lower lows, line d.
The A/D line rose sharply Friday and is back above its WMA and is close to breaking its short term downtrend, line c. The A/D line has more important resistance at line b, and a break above this level would be an intermediate term positive signal. The OBV also formed lower lows, line f. It is now back above its WMA with key resistance at line e.
Over the weekend I will be providing charts of the SPDR Dow Jones Industrials (DIA), Powershares QQQ Trust (QQQ) and the iShares Russell 2000 (IWM) on Twitter and StockTwits.
What to do?
The stock market now needs to continue higher to confirm the positive divergences as the A/D numbers will be quite important. Two consecutive higher closes should start to worry the market bears as most media analysts are quite negative on the stock market.
Both the SPDR Dow Jones Industrials (DIA) and Powershares QQQ Trust (QQQ) closed on Friday above their quarterly pivots which is a positive sign. The stock market typically bottoms in the first week of October. Historically October is a positive month for all of the major averages with the Dow Industrials doing the best.
If the bullish divergences are confirmed this is likely the start of the rally have been looking for over the past few weeks (Make Your Fall Portfolio Plans Now). The strength of the rally will be important factor in determining whether this rally is part of the topping process or whether the market has formed an important low.
The utilities and REITS continue to show the best relative performance but it will be important for investors to monitor their holdings as the market continues higher. Those stocks or ETFs that perform worse than the S&P 500 should be sold when they reach important resistance.
Comments
comments