
The powerful stock market gains on Friday have pushed the S&P 500 to a 1.48% gain for the month of December. Surprisingly that is close to the average December return for the S&P 500 of 1.54% since 1950. There have been 50 up years since 1950 with just 17 down years.
One can examine the historical seasonal trends by looking at the monthly performance over time as well as by using software like Trade Navigator to analysis the historical price data to find tendencies.


In this chart the Seasonal Trend chart underneath the price graph is the result of looking at the S&P 500 data going back to 1929. It is important to compare the seasonal trend analysis with the technical data before one acts.
In other words when a market has a seasonal tendency to top at a certain time every year then one should only act if there are corresponding negative signs from technical studies like the A/D lines. In 2016 the S&P topped out on schedule (line 1) in late April and then formed a secondary top in August (line 2 )
The typical seasonal low occurs by December, line 3, and the 2016 low coincided with very strong readings from the A/D line and therefore supported the seasonal tendency. I also find it beneficial to look at how the market has performed during the same months in a stock market cycle.


Since the bull market low in 2009 the S&P 500 has been up six years in December and down just two years. The best gain was 5.99% in 2010 followed by 2.31% in 2013. The worst year was 2015 when it dropped 1.87%. So what happened in recent years after a strong gain in December?
In 2010 after a 5.99% gain, the Spyder Trust (SPY) was up 2.27 % in January and then added another 2.95% in February. In fact from the December 2010 close the SPY not peak until May as it had a high of $120.06 before it closed lower for the month at $118.06.
This was the start of a six month decline that took the SPY to a low of $94.98 in October 2011 which was a decline of 20.9%. Therefore from the December close the SPY rallied 8.7% before correcting over 20% by the fall.
Even though 2017 has been a banner year for the stock market with the Spyder Trust (SPY) up 21.5% it still lags the performance in 2013 when it was up 32.3%. The 2.31% gain in December 2013 was followed by a 3.4% decline in January 2014. The SPY did manage to rebound from the February lows to close higher. It rallied for the next four months until it closed lower in July 2014.
The stock market was slightly lower in December 2014 as it formed a doji. The SPY dropped 3.1% in January 2015 but rallied by 5.4% in February and continued higher until May-June when the A/D line started to diverge from prices. This was followed by the sharp decline in August 2015 which corresponded nicely with the top based on the seasonal trend analysis.
The divergence in the A/D line (see shaded area) was not overcome until March 2016 when the S&P 500 A/D line made a new high. Since then the monthly A/D line has made a series of new highs and is on track to make another new high in December of 2017. The gain of 1.8% last December was followed strength in 2017 as the SPY was up just over 3% in January 2017.
For December 2017 the monthly starc+ band is at $265.19 which is below Friday’s close at $267.12. The high last week was close to the monthly pivot resistance at $267.48 but both the weekly and daily S&P A/D lines are making new highs. It would likely take several months for any serious weekly divergences to develop which bodes well for the first quarter of 2018.
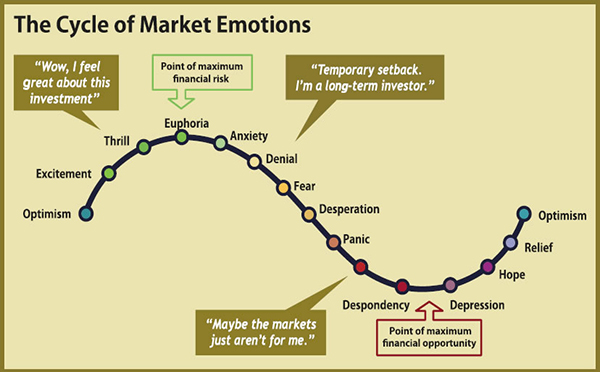
The market has clearly entered the euphoric phase which is something that has been missing from this bull market (The Week Ahead: What's Missing From This Bull Market?) During the dot.com market one can make the case that the market entered the euphoric phase in early 1999 and continued to move higher until March 2000.


This interesting long term logarithmic Dow chart give one an interesting perspective. I have added a resistance level derived from the 1929 and 2000 highs, line a, which has now been reached. Also on the chart is the major continuation pattern (red lines) that developed from the 2000 high to the 2008 low. The upside target from this formation has been exceeded.
The Economy


There were few surprises last week in the economic news as the FOMC did raise rates and both the PPI and CPI data came in as expected. Retail Sales rose 0.8% over double what the market was expecting. The chart shows the sharp spike in September but more important in my view is the rise in the yearly rate which shows a nice uptrend.
Friday’s Empire State Manufacturing met the consensus estimate but was a bit lower from the prior month. Industrial Production was up 0.2% a bit lower than the consensus estimate of 0.3%.
On Monday we get the Housing Market Index as recent reports have reflected growing confidence amongst the home builders. This is followed by Housing Starts Tuesday and Existing Home Sales on Wednesday. New Home Sales are out on Friday.
The focus for the week is likely to be on the final reading for the 3rd quarter GDP. Also out on Thursday are the Philadelphia Business Outlook Survey, Chicago National Activity Index and Leading Indicators. On Friday we also have Durable Goods and Consumer Sentiment.
Interest Rates & Crude Oil


The bond market does not appear to be impressed by the tax bill or the administrations bullish outlook for the economy as yields closed lower last week. They have been locked in a narrow range for the past seven weeks and a drop below 2.30% is likely to signal even lower yields. The weekly MACD is losing some upside momentum and could roll over to a sell in the coming weeks. The daily MACD is slightly negative.
Personally I do believe the tax bill will have the desired impact on the economy and found that the column by Michael Bloomberg was right on target. He said in part ”It’s pure fantasy to think that the tax bill will lead to significantly higher wages and growth, as Republicans have promised. Had Congress actually listened to executives, or economists who study these issues carefully, it might have realized that. “


The February crude oil contract continues to bump into the resistance in the $59 area (line a) and formed a doji last week. It is well above the 20 week EMA at $55.13. The OBV has just dropped below its WMA and is well below the highs from early in the year, line b. The HPI has moved above the highs from 2016 and is still holding above its WMA. A drop below it is possible by year end and the daily HPI is peaked in early November.
Market Wrap
The Dow Industrial and Nasdaq Composite were strong last week as they gained 1.33% and 1.41% respectively. The S&P 500 was up just 0.91% while both the Dow Transports and Dow Utilities closed lower. The small cap Russell 2000 was up 0.57% while on the NYSE there were 1562 advancing stocks and 1525 declining.


The PowerShares QQQ was impressive last week as it was up 2.1% closing well above the recent weekly highs. The monthly pivot resistance is at $160.12 with the weekly starc+ band at $161.03. There is important support now at $151.78-$152.06.
The weekly Nasdaq 100 A/D line made further new highs and the daily A/D is rising even more sharply. The weekly OBV has also made new highs and is well above its rising WMA.

Even though the gains were not impressive last week in the iShares Russell 2000 (IWM) the weekly technical outlook did improve. The weekly starc+ band is at $157.42 with further resistance in the $160 area.
The Russell 2000 A/D line made higher highs at the start of the month, line a, and is well above its WMA. The daily A/D line just moved above its WMA on Friday. The weekly OBV has broken out to a new high (point b) which is a bullish sign.
The weekly A/D lines that track the SPDR Dow Industrials (DIA) and NYSE Composite also made new highs last week which confirms the price action. The number of stocks making new highs last week was not impressive.
What to do? There is no reason to change the bullish stance on the market but I am not sure the sailing will be as smooth in 2018 as I do expect a significant uptick in volatility. In talking to clients there is a certain amount of complacency as concerns over risk seem to have diminished.
In some ways it reminds me of the transition from 2013 to 2014. In 2013 the market was even stronger but there was no euphoria. The decline in late January caught many by surprise and there were even sharper declines in August and October. It was not a good year to be complacent.
Therefore I would suggest you continue to monitor the A/D lines for warnings of the next correction. Clearly there are no signs of an intermediate term correction, bear market or a recession. Viper ETF clients are long a wide range of domestic and overseas ETFs. Traders bought the SPDR KBW Bank ETF (KBE) on the recent pullback.
Stocks traders who follow the Viper Hot Stocks analysis are focused on primarily on the long side as there are a number of stocks that have just started to turn higher.
If you are interested in this type of analysis I hope you will consider the Viper ETF or Viper Hot Stocks reports as specific recommendations are sent out twice each week. Each report is only $34.95 per month.
Comments
comments